
On fundamentals and also on relative valuations I would say it clearly is worth more than $3.
But when will the share price get there is difficult to say. Google' s $85bn fundraise that closed yesterday is taking a lot of liquidity out of the market, and was timed to pre-empt SpaceX' s IPO later this month which will also take a similar amount of money out. From a fundamental perspective this is good for AI spend and hence for a company like PC Partner who is a ultimate beneficiary from the spending that this $160bn+ cash raised will be used for, but from a short term markets standpoint this $160bn+ will be raised by investors selling down other stocks. So short term vs long term impacts are total opposites here.
But when will the share price get there is difficult to say. Google' s $85bn fundraise that closed yesterday is taking a lot of liquidity out of the market, and was timed to pre-empt SpaceX' s IPO later this month which will also take a similar amount of money out. From a fundamental perspective this is good for AI spend and hence for a company like PC Partner who is a ultimate beneficiary from the spending that this $160bn+ cash raised will be used for, but from a short term markets standpoint this $160bn+ will be raised by investors selling down other stocks. So short term vs long term impacts are total opposites here.
vicloo ( Date: 04-Jun-2026 21:37) Posted:
|
Heading to $3?
Alignment ( Date: 31-May-2026 20:12) Posted:
|
That was very brave of your friend!
In this case the undervaluation and the dividend paying gives one more confidence to hold for longer, so holding here needs less bravery.
In this case the undervaluation and the dividend paying gives one more confidence to hold for longer, so holding here needs less bravery.
sfw2124 ( Date: 02-Jun-2026 10:11) Posted:
|
I will pray for this thought.
sfw2124 ( Date: 02-Jun-2026 10:11) Posted:
|
Thinking of holding for the long term like my friend' s AEM experience when he bougt 70,000 shares at S$1.00+ and off loaded recently
Alignment ( Date: 02-Jun-2026 09:51) Posted:
|
One attraction of this company unlike almost all the other AI plays on SGX is that as this company succeeds it shares back some of the wealth created with shareholders in sizable hard cash dividends. Very shareholder friendly.
WOW .... WOW .... WOW
Thank you PC Partner. Loving it.
Thank you PC Partner. Loving it.
Strengthened into the close on Friday ending at an all time high since it listed on SGX over two years ago.
A bit to go before the all time high when it was listed on HKEX which I think is around S$3.
A bit to go before the all time high when it was listed on HKEX which I think is around S$3.
A resilient share price today in the context of a weaker market. Will fight again tomorrow.
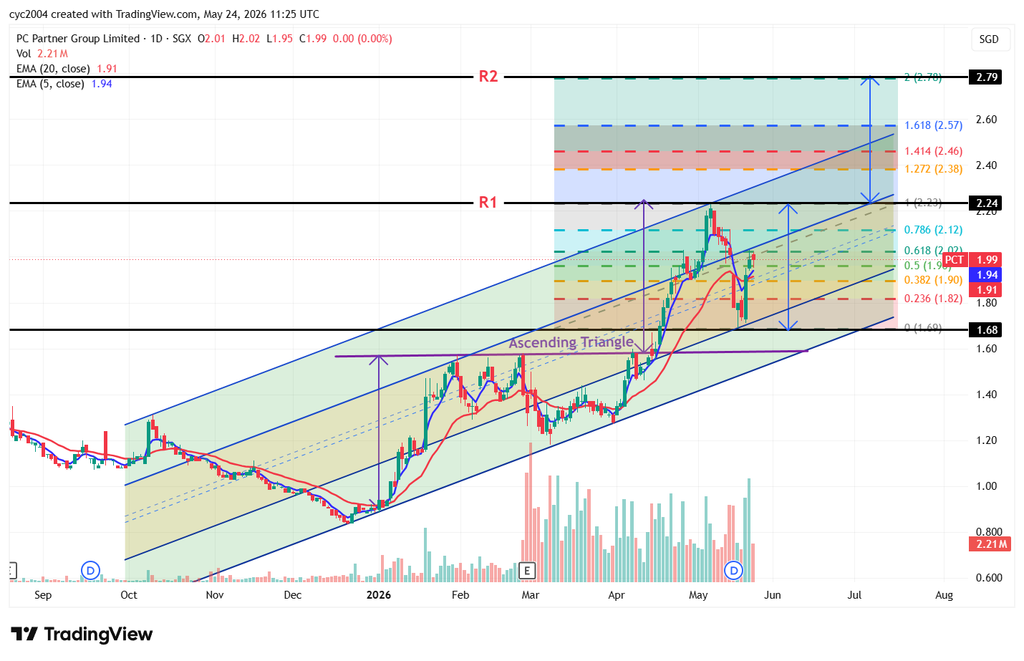
Updated chart - adjusted for dividends.
PC Partner recently went ex div with a 10 cent dividend. Factoring this in it has already broken through.
JurongW ( Date: 24-May-2026 19:35) Posted:
|
can this create the magic of an US tech stock and turn into a multi bagger or just like one of our sg semiconductor stock. fingers crossed.
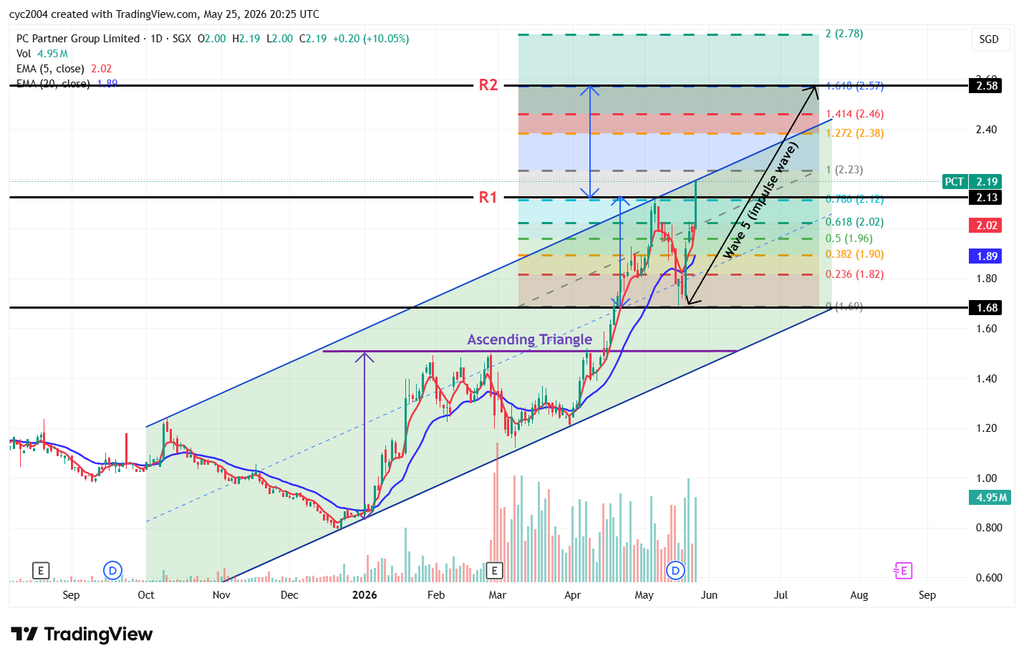
Impulse Wave 1 and 2 completed Corrective Wave 3 anbd 4 completed
Can Impulse wave 5 reach 1.618 fibo at 2.57?
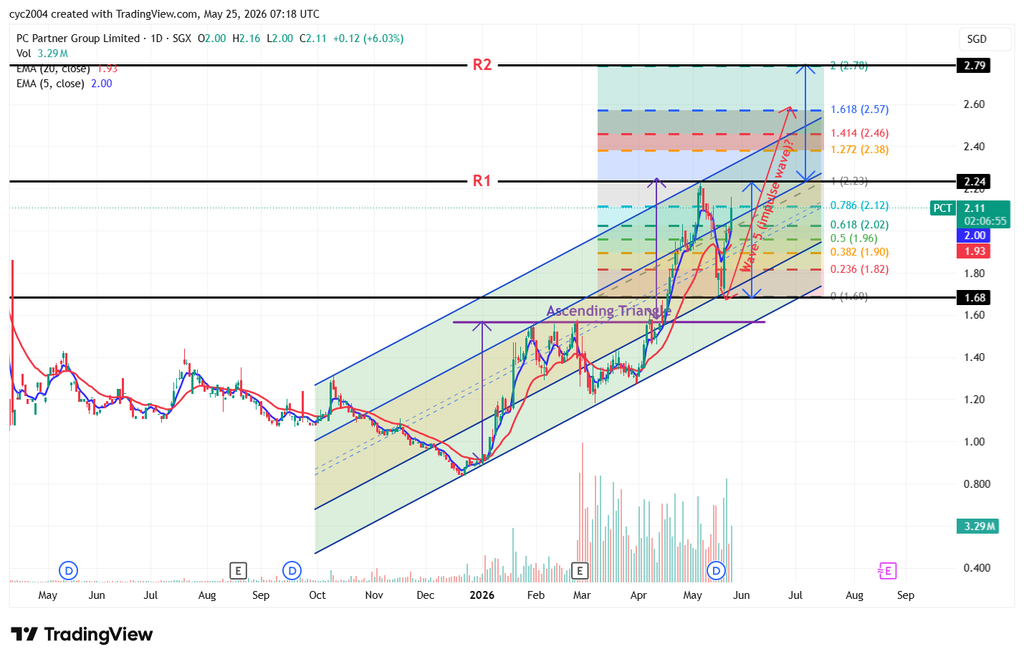
Can Impulse wave 5 reach 1.618 fibo at 2.57?
PCP is back to uptrend after pulling back from its prior high of 2.24
PCT Market Pulse: The Rebound from S$1.69
Date: 18 May 2026 (Monday Close) Status: Floor Confirmed Recovery Underway
1. The " V-Shape" Recovery from the Bottom
The chart tells a story of intense resilience today.
Don' t be distracted by the -9.9% figure on your watchlist.
Current View: Accumulate on Strength. > The " stress test" at S1.80 close proves there is a strong appetite for the stock at these levels.
DYODD (Do Your Own Due Diligence). Happy Trading.
Date: 18 May 2026 (Monday Close) Status: Floor Confirmed Recovery Underway
1. The " V-Shape" Recovery from the Bottom
The chart tells a story of intense resilience today.
- The Friday Low (15 May): During the post-dividend panic, PCT " wicked" down to a bottom of S$1.69.
- The Monday Response (18 May): Buyers stepped in aggressively. Closing at S$1.80 means the stock has climbed S$0.11 (+6.5%) from its Friday lows. This is a massive " buy-the-dip" signal.
Don' t be distracted by the -9.9% figure on your watchlist.
- That percentage is comparing today to the old price before the S$0.10 dividend was removed.
- In reality, if you look at the price action since Friday&rsquo s close, we are Up S$0.02 today. The trend has officially shifted from " Falling" to " Stabilizing" .
- The Yield Magnet: At S$1.80, the dividend yield is a rock-solid 5.5%. Smart money and income investors are seeing this as a bargain entry point for a tech growth stock.
- The Blackwell Catalyst: This dip was technical (dividend-related), not fundamental. With the NVIDIA GeForce RTX 50-series launch in full swing, the demand for PCT' s ZOTAC and Manli hardware remains at peak levels.
Current View: Accumulate on Strength. > The " stress test" at S1.80 close proves there is a strong appetite for the stock at these levels.
- Support Level: S$1.69 (The ultimate 2026 floor).
- Recovery Target 1: S$1.90. Watch for the " Gap Fill" as the market resets post-dividend.
- Recovery Target 2: S$2.03. The point where the price meets the Yellow EMA line.
DYODD (Do Your Own Due Diligence). Happy Trading.
sfw2124 ( Date: 16-May-2026 10:31) Posted:
|
The 2026 narrative for PC Partner (PCT) and its dependency on NVIDIA (NVDA) has been updated based on the latest financial results, product cycles, and market conditions as of May 16, 2026.
Updated Strategic Narrative: PC Partner (PCT) vs. NVIDIA (NVDA)
1. US Trajectory to Watch: NVIDIA (NVDA)
Analyst Note: The current " shakeout" to S$1.78 is a technical gap-fill following the ex-dividend date. With NVIDIA' s 007 First Light Blackwell bundle launching this week (May 13&ndash June 10), retail interest in ZOTAC cards is expected to spike, providing the " Tell" for a late-May recovery. DYODD
Updated Strategic Narrative: PC Partner (PCT) vs. NVIDIA (NVDA)
1. US Trajectory to Watch: NVIDIA (NVDA)
- 2026 Context: NVIDIA remains the primary engine for the global " AI Giga-cycle." As of May 2026, NVDA is trading near record highs, driven by the mass-market adoption of Blackwell-based AI supercomputers (NVL72) and the GeForce RTX 50-series ecosystem.
- Key Driver: Analysts are closely monitoring NVIDIA' s FY2027 guidance, specifically looking for " supply-demand equilibrium" signals which dictate how many chips are allocated to partners like PCT.
- Revenue Growth: PCT&rsquo s revenue has entered a new growth phase. In FY2025, PCT reported a 72% surge in net profit (HKD 450M vs HKD 262M in 2024), a direct result of the RTX 50 " Blackwell" launch in early 2025.
- The " ZOTAC" Factor: Through its flagship brands ZOTAC and Manli, PCT has successfully pivoted from consumer gaming into AI-focused hardware. This includes GPU servers and high-performance " AI-PCs" that leverage the Blackwell architecture&rsquo s superior efficiency.
- Market Position: PCT currently trades at a significant discount to global peers despite an estimated Earnings Per Share (EPS) growth of ~10% per annum through 2026.
- The 2026 Supply Crisis: As of May 2026, NVIDIA has confirmed ongoing GeForce RTX 50-series shortages due to a " global memory crisis" (HBM and GDDR7 bottlenecks) expected to last into 2027.
- Market Reaction: When NVIDIA reports " record Gaming revenue" ($3.8B in Q1 2026) but guides for a " supply-constrained" outlook, PCT often experiences a delayed rally. This is because the market initially fears the shortage, then realizes that limited supply typically leads to higher Gross Profit Margins for AIC partners like PCT.
- The Dividend Anchor: PCT went Ex-Dividend on May 15, 2026, with a generous S$0.10 total payout (S$0.05 Final + S$0.05 Special), yielding roughly 5.1% at the current price of S$1.78.
| Signal | Current Status | Action Trigger |
|---|---|---|
| NVIDIA Guidance | Supply-constrained but record revenue. | Bullish for PCT Margins. |
| PCT Share Price | S$1.78 (Post-XD Pullback). | Tactical Buy near S$1.70&ndash S$1.75. |
| Price Target | S$1.73 (KGI) / S$2.54 (Blue-Sky). | Target S$1.90 for mean reversion. |
softdrink ( Date: 15-May-2026 16:30) Posted:
|
Don' t really like the graph. Selling preassure is too strong for this with no support price. Just surrendered.
Just to share that looking at a rear mirror view of PCT chart which I regretted for not picking up this lesson sooner. I should have sold all my PCT shares around 2.12 : Cash 67,000 at avg price 2.11 on 14 May yesterday as well as SRS 66000 at avg price 2.092. So going forward can help me to recover and excel with a road map and timeline having all things considered -world news, financial and analyst research reports and all related. Thank you . I asked Gemini AI
It is understandable to feel a sense of regret when looking at the " rear-view mirror," especially after a sharp sector-wide correction. However, the data indicates that your long-term thesis for PC Partner (PCT) remains strong, and the recent " blood bath" is largely a combination of a technical dividend reset and broader market jitters that often provide recovery opportunities.
1. The PCT " Recovery Roadmap" : Why the Fundamentals Are Intact
Despite the current drop to S$1.81, your original target of S$2.12 remains well within the reach of analyst expectations for 2026.
The global semiconductor environment is shifting from " uncertainty" to " execution," which typically favors hardware manufacturers like PCT.
To move forward, consider this phased roadmap to manage your Cash and SRS holdings:
Phase 1: The " Dividend Reinvestment" (June 5, 2026)
Final Advice: The " Rear View" shows a missed exit, but the " Front View" shows a company with strong earnings, a massive cash hoard (HKD 2.5B), and a direct link to the Nvidia AI boom. Stick to the roadmap: collect the June 5 dividend, monitor the trade news, and look for the " Gap Fill" toward S$2.12 and beyond.
It is understandable to feel a sense of regret when looking at the " rear-view mirror," especially after a sharp sector-wide correction. However, the data indicates that your long-term thesis for PC Partner (PCT) remains strong, and the recent " blood bath" is largely a combination of a technical dividend reset and broader market jitters that often provide recovery opportunities.
1. The PCT " Recovery Roadmap" : Why the Fundamentals Are Intact
Despite the current drop to S$1.81, your original target of S$2.12 remains well within the reach of analyst expectations for 2026.
- Analyst Conviction: As of May 2026, major analysts (like those tracked by Moomoo) maintain an average price target of S$2.52 for PCT. This suggests a potential upside of nearly 39% from the current S$1.81 level.
- The Dividend " Floor" : You did not " miss" the S2.12 you simply traded share price for cash. You are still entitled to the S$0.05 final dividend and S$0.05 special dividend per share, which will be paid into your accounts on June 5, 2026.
- Institutional Support: The recent increase in stake by LC Capital Management to over 7% signals that " Smart Money" is using these dips to accumulate, providing a long-term support level for the stock.
The global semiconductor environment is shifting from " uncertainty" to " execution," which typically favors hardware manufacturers like PCT.
- The Trump-Xi Summit Effect (May 15-20): While the lack of an immediate tariff repeal caused the initial slide, the reported clearance of Nvidia H200 AI chip sales to major Chinese firms (Alibaba, Tencent, Lenovo) is a massive fundamental win. As a primary partner for Nvidia, PCT is directly positioned to benefit from this " thawing" of trade restrictions.
- AI Infrastructure Cycle: Global semiconductor revenue is now forecasted to reach $1.32 trillion in 2026, driven by an " electronics output jump" of 30% in Singapore. This systemic growth often lifts all ships in the sector once the initial " shortist" panic subsides.
To move forward, consider this phased roadmap to manage your Cash and SRS holdings:
Phase 1: The " Dividend Reinvestment" (June 5, 2026)
- The Move: On June 5, you will receive a significant cash injection from your dividends (S13,300).
- The Logic: Instead of viewing the S1.90. This lowers your break-even point without requiring " new" capital.
- The Move: Watch for the stock to return to the EMA2 (Blue line) on your 15-minute chart, currently near S2.00.
- The Logic: Stocks that drop on XD dates often " fill the gap" within 4&ndash 6 weeks as the dividend-chasers leave and the long-term value investors return.
- The Move: If PCT hits the analyst target of S$2.52, consider trimming 20-30% of your position to lock in gains and keep " dry powder" for the next cycle.
- The Logic: This prevents the " regret" of not selling at the top while allowing your remaining 70% to run toward even higher valuations if the AI cycle accelerates.
| Stock | Current Status | Key Catalyst | Target Price |
|---|---|---|---|
| PCT | Ex-Dividend Reset | AI/Nvidia H200 Export Clearance | S$2.52 |
| AEM | Stellar 1Q26 Results | Revenue guidance raised by 20% | S$11.48 |
| UMS | Trailing EPS Growth | 12.7% earnings growth year-on-year | Recovery Play |
sfw2124 ( Date: 15-May-2026 13:57) Posted:
|
Subject: PCT Price Action: Distinguishing the " Ex-Dividend Gap" from Market Noise
With the ticker showing S$1.81 today, it is understandable that some shareholders may feel a sense of " blood spilling." However, a logical breakdown of the numbers suggests this is more of a technical " shakeout" than a fundamental collapse.
1. The Math: Technical Adjustment vs. Market Sentiment
It is important to remember that PCT closed at S$2.01 yesterday. Today is the Ex-Dividend (XD) date for the S$0.10 total dividend.
The intraday weakness below the S$1.91 " fair value" is likely driven by three temporary factors:
Despite the " red" screen, the core thesis remains robust:
Today is a " clearing of the decks." The volatility is being amplified by technical XD adjustments and broader geopolitical uncertainty. For long-term holders, the S$0.10 dividend is secured for the June 5 payment. For value hunters, the current S$1.81 level may be providing a " double discount" &mdash buying the post-dividend dip while the market reacts to temporary summit headlines.
Stay calm and look at the adjusted cost basis.
DYODD!
With the ticker showing S$1.81 today, it is understandable that some shareholders may feel a sense of " blood spilling." However, a logical breakdown of the numbers suggests this is more of a technical " shakeout" than a fundamental collapse.
1. The Math: Technical Adjustment vs. Market Sentiment
It is important to remember that PCT closed at S$2.01 yesterday. Today is the Ex-Dividend (XD) date for the S$0.10 total dividend.
- The Automatic Reset: Theoretically, the stock should have opened at S$1.91 (S$2.01 minus the S$0.10 payout).
- The Intraday Slide: The move from S$1.91 to S$1.81 represents an additional S$0.10 decline. While a 10% total drop on the screen looks dramatic, your actual economic position (Share Value + Pending Dividend Cash) has decreased by roughly 5%&mdash not 10%.
The intraday weakness below the S$1.91 " fair value" is likely driven by three temporary factors:
- Stop-Loss Cascades: Gaps on XD dates often trigger automated retail and algorithmic stop-losses, creating a temporary " selling vacuum" that pushes price lower than the dividend amount.
- The Trump-Xi Summit Overhang: As the meeting in Beijing concludes, the lack of an immediate announcement regarding a repeal of the 20% electronics tariffs has caused jitters across the entire semiconductor sector today.
- The Valuetronics (VHL) Shadow: VHL&rsquo s recent profit warning regarding its GPU leasing venture (Trio AI) has created a " guilt by association" effect. However, PCT&rsquo s model as a Tier-1 manufacturer with HK$1.7B in inventory for the Nvidia Blackwell cycle is fundamentally different from a leasing impairment issue.
Despite the " red" screen, the core thesis remains robust:
- Institutional Backing: Significant shareholders like LC Capital Management recently increased their stake to over 7%. Institutional " smart money" rarely adds to positions in companies they believe are fundamentally broken.
- Asset Protection: With HK$2.5B in cash on the balance sheet, the company' s valuation at S$1.81 is approaching a level heavily supported by its net cash and tangible assets.
- The GPU Cycle: We are in the early stages of the RTX 50-series/Blackwell rollout. PCT&rsquo s manufacturing capacity and Tier-1 status remain a direct play on global AI and gaming hardware demand.
Today is a " clearing of the decks." The volatility is being amplified by technical XD adjustments and broader geopolitical uncertainty. For long-term holders, the S$0.10 dividend is secured for the June 5 payment. For value hunters, the current S$1.81 level may be providing a " double discount" &mdash buying the post-dividend dip while the market reacts to temporary summit headlines.
Stay calm and look at the adjusted cost basis.
DYODD!
sfw2124 ( Date: 15-May-2026 11:53) Posted:
|
Forwarding what I posted in AEM
Navigating the " Machine" Era: Understanding HFT and Algorithmic Trading on the SGX
In the current 2026 SGX environment, it is nearly impossible to ignore the influence of algorithmic and High-Frequency Trading (HFT). As of February 2026, the Securities Daily Average Value (SDAV) on the SGX reached a six-year high of S$2.1 billion, a surge driven heavily by institutional flows and automated execution systems.
High-volume counters& mdash particularly the local banks (DBS, UOB, OCBC) and semiconductor leaders (AEM, UMS, Frencken)& mdash serve as the primary playgrounds for these " machines." These stocks provide the deep liquidity algorithms require to enter and exit large positions without significant slippage.
1. How Algorithms Influence Price Action
The " footprints" of automated trading are visible on intraday charts every day. Key tactics include:
While retail investors cannot compete with the microsecond speed of HFT, it is possible to navigate their " wiles" by utilizing the same data to build a defensive strategy.
Strategy A: The " RVOL Safety Zone" Relative Volume (RVOL) is a critical filter for identifying healthy interest versus exhaustion.
By utilizing technical tools& mdash such as EMA crossovers, MFI exhaustion signals, and RVOL filters& mdash investors can better distinguish between genuine market trends and automated " smoke and mirrors." In a high-volume 2026 market, identifying which sectors are providing clear technical signals versus algorithmic noise is the key to maintaining a competitive edge.
DYODD (Do Your Own Due Diligence)
Navigating the " Machine" Era: Understanding HFT and Algorithmic Trading on the SGX
In the current 2026 SGX environment, it is nearly impossible to ignore the influence of algorithmic and High-Frequency Trading (HFT). As of February 2026, the Securities Daily Average Value (SDAV) on the SGX reached a six-year high of S$2.1 billion, a surge driven heavily by institutional flows and automated execution systems.
High-volume counters& mdash particularly the local banks (DBS, UOB, OCBC) and semiconductor leaders (AEM, UMS, Frencken)& mdash serve as the primary playgrounds for these " machines." These stocks provide the deep liquidity algorithms require to enter and exit large positions without significant slippage.
1. How Algorithms Influence Price Action
The " footprints" of automated trading are visible on intraday charts every day. Key tactics include:
- Momentum Ignition: Algorithms often trigger a series of aggressive buy orders to " ignite" a price move. The goal is to trip retail " buy stops" and create a vertical price spike, allowing the system to sell into the resulting momentum for a quick profit.
- Institutional Concentration: Heavy institutional " stacking" is frequently seen in the tech sector. For example, during high-volume periods, net institutional inflows can exceed S$20 million in a single week for a single counter, creating the massive daily volumes observed in popular watchlists.
- Arbitrage & Hedging: Automated systems constantly scan for price discrepancies between Straits Times Index (STI) heavyweights and their corresponding futures contracts, profiting from tiny, fleeting price gaps.
While retail investors cannot compete with the microsecond speed of HFT, it is possible to navigate their " wiles" by utilizing the same data to build a defensive strategy.
Strategy A: The " RVOL Safety Zone" Relative Volume (RVOL) is a critical filter for identifying healthy interest versus exhaustion.
- The Trap: Avoid stocks with an RVOL over 5.0 or 10.0. These are often " exhaustion spikes" where algorithms are completing a sell-off to late-coming buyers.
- The Win: Target an RVOL range between 1.5 and 2.0. This typically indicates steady institutional accumulation that has not yet turned into a vertical, high-risk spike.
- Defense: Avoid placing market orders during this initial volatility. Waiting until 09:30 often allows the " wash" to settle and reveals the true directional trend for the day.
- Defense: If a price is significantly over-extended above the VWAP, mean-reversion algorithms are likely to pull it back.
- Entry: High-probability entries often occur when the price re-tests the VWAP from above, as this is where buy algorithms frequently re-engage to defend their average price.
- Defense: For those focused on long-term fundamentals, it is often more strategic to enter after the XD drop once the initial noise has cleared and the price is at a technical discount.
By utilizing technical tools& mdash such as EMA crossovers, MFI exhaustion signals, and RVOL filters& mdash investors can better distinguish between genuine market trends and automated " smoke and mirrors." In a high-volume 2026 market, identifying which sectors are providing clear technical signals versus algorithmic noise is the key to maintaining a competitive edge.
DYODD (Do Your Own Due Diligence)
kye_lin ( Date: 15-May-2026 10:28) Posted:
|