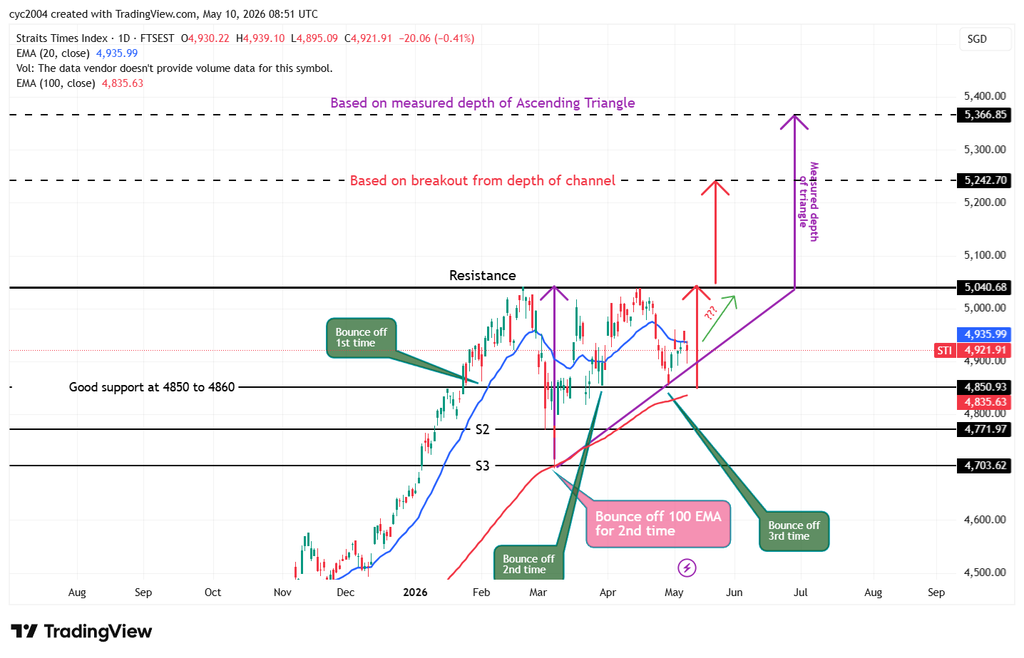
STI is enjoying a strong day led by the banks, Singtel, STE, and SGX.
The question now &mdash can this momentum finally carry it past the 5,040 barrier by this Friday.
The question now &mdash can this momentum finally carry it past the 5,040 barrier by this Friday.
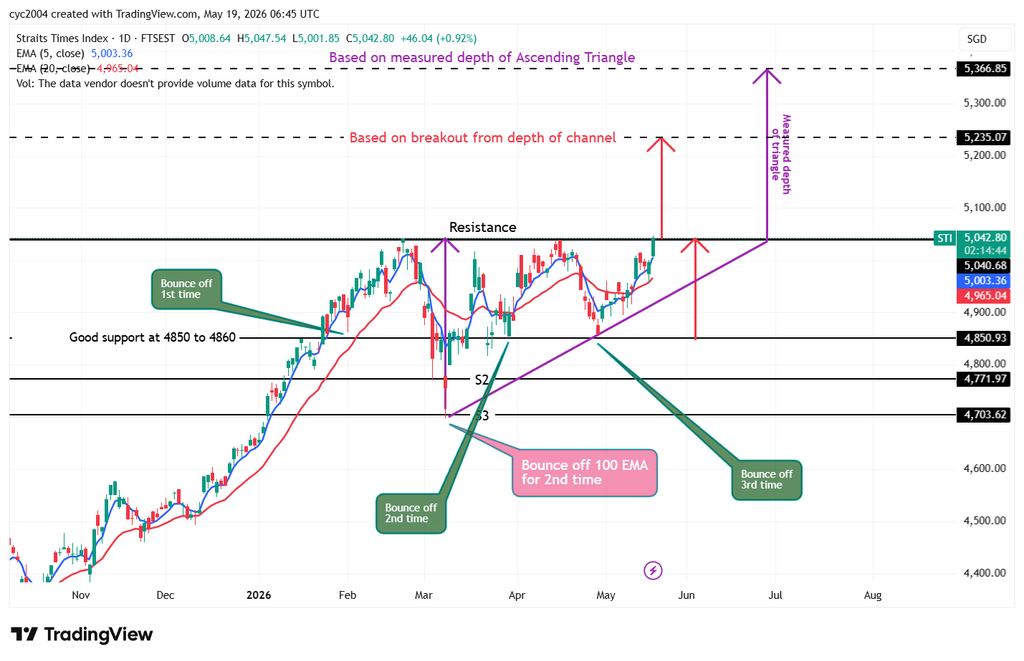
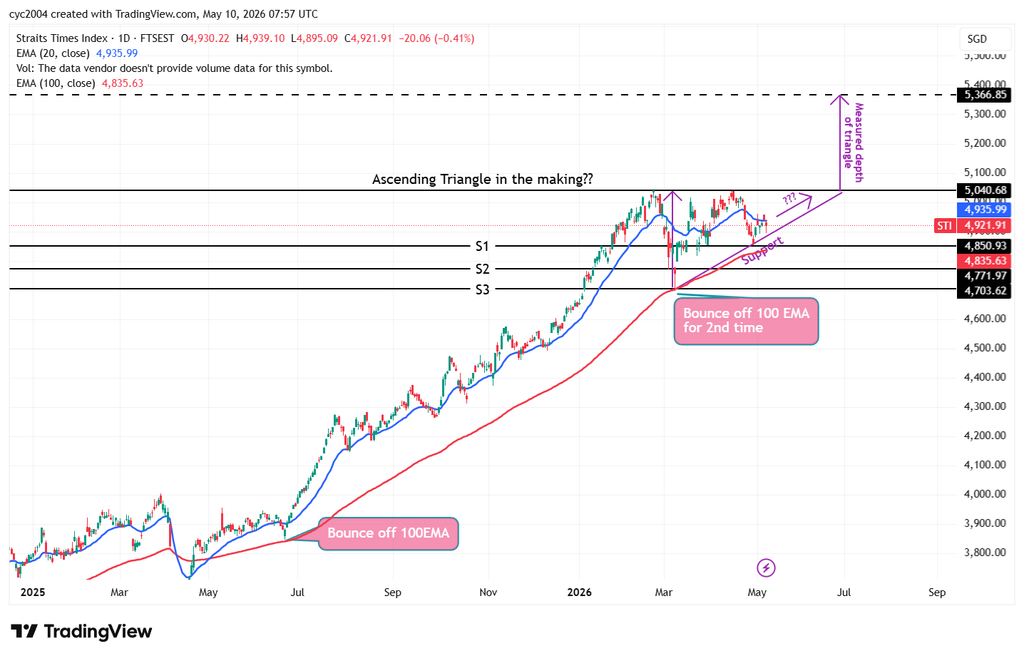
STI on its way to test 5040 for the third time. Can it breakout this time or fall back to test the support of the ascending triangle.
Let' s watch on.
Let' s watch on.
Let' s see if STI can stay above 20 and 50 EMA this week. Currently 20EMA is above 50 EMA (not indicated on chart)
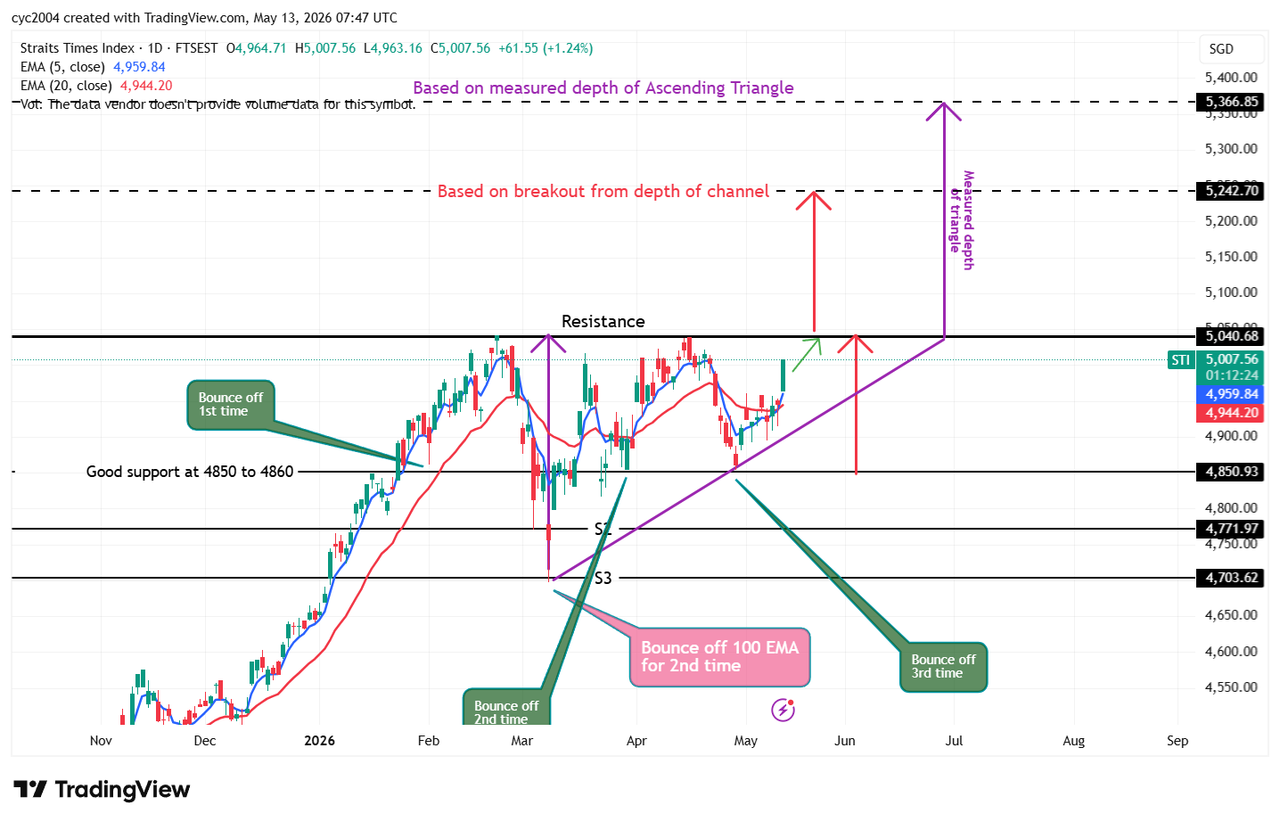
Sell in May and Go Away or Buy in May and Fly Away
March and April ended in red - May' s fate rests on the heavy weights DBS, OCBC, UOB and Singtel (Combined > 58% weightage)
March and April ended in red - May' s fate rests on the heavy weights DBS, OCBC, UOB and Singtel (Combined > 58% weightage)
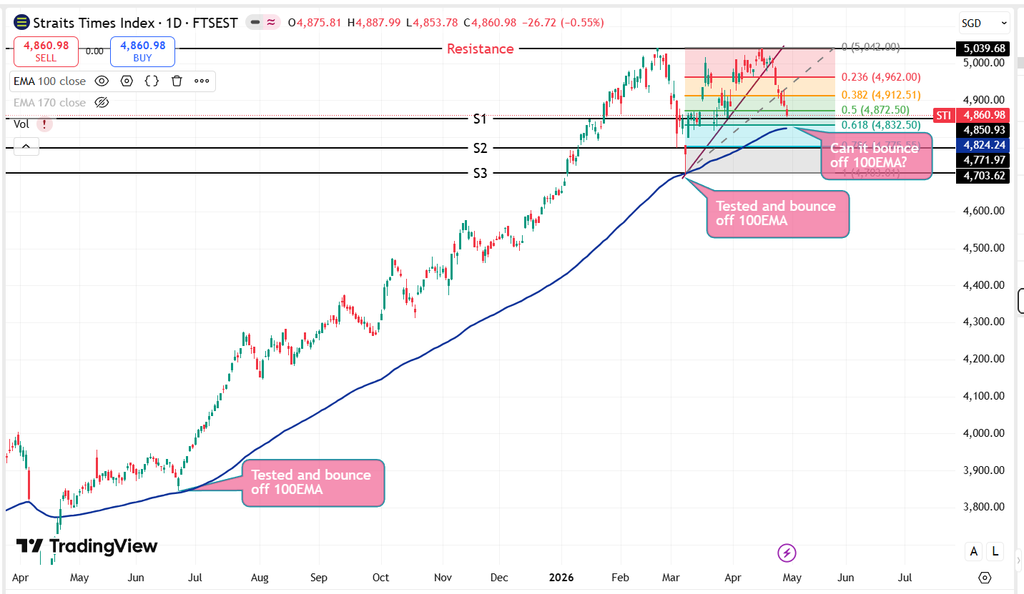
.STI did not get the chance to test the 100EMA today, closing 51 points above yesterday.
On the weekly chart, a hammer has formed - a positive sign that bodes well for next week, barring weak results from UOB and OCBC.
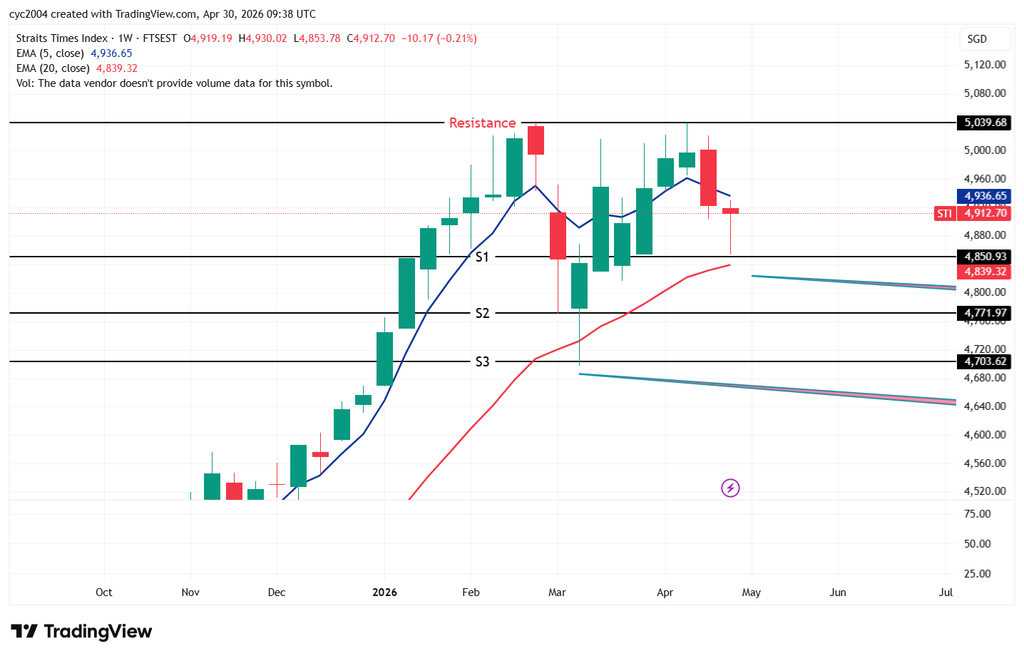
On the weekly chart, a hammer has formed - a positive sign that bodes well for next week, barring weak results from UOB and OCBC.
JurongW ( Date: 29-Apr-2026 23:37) Posted:
|
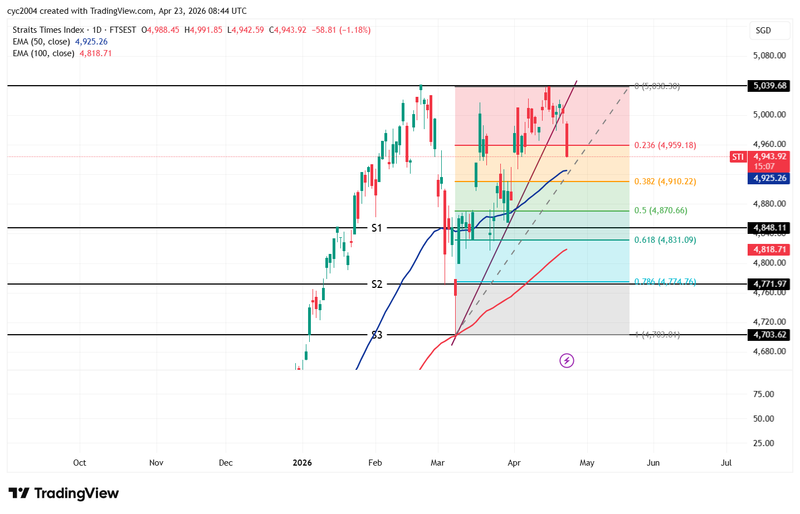
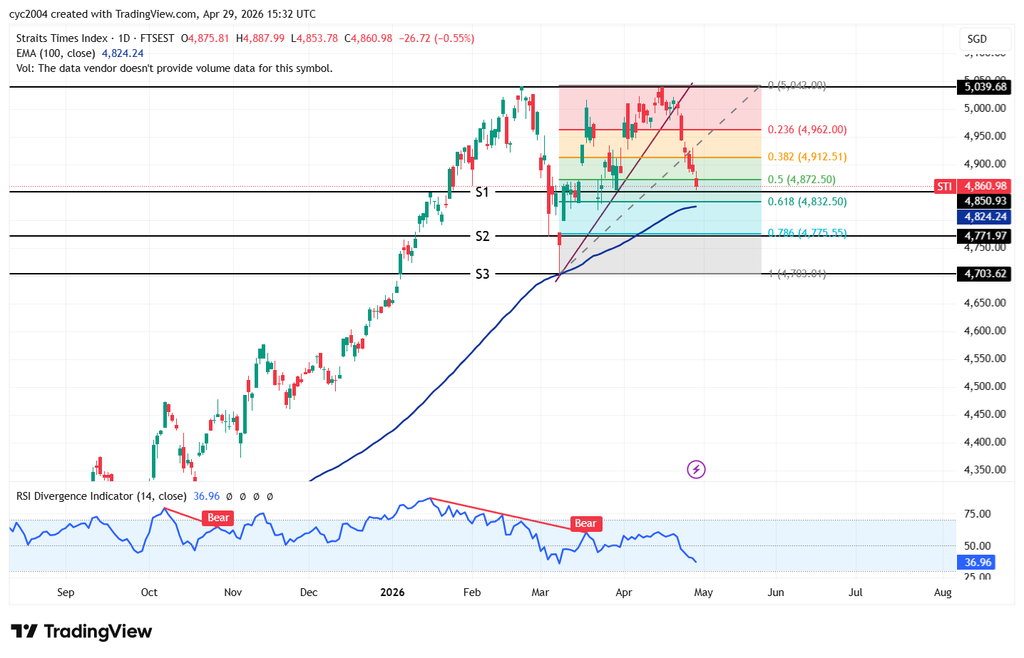
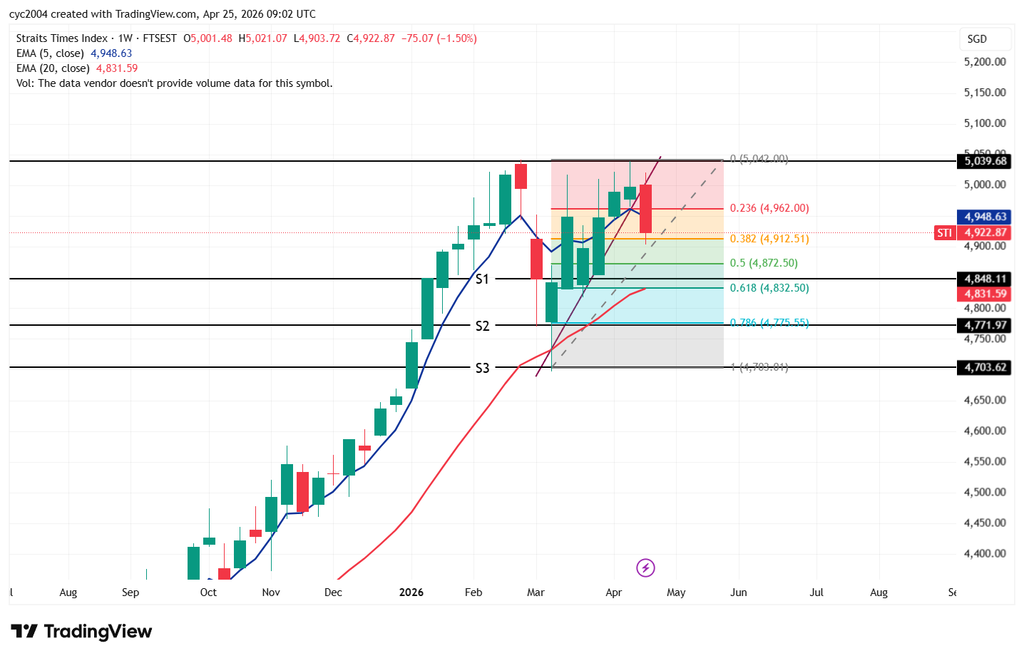
Let&rsquo s see if STI can find a bottom at the 100EMA or the 0.618 Fibonacci level around 4,830.
RSI is sliding toward the oversold region, so STI' s move in the next few trading sessions will be telling.
On 24 Apr, the weekly chart printed a bearish engulfing candlestick, swallowing the prior two weeks&rsquo candles.
This signals strong downside momentum and raises caution for the near term.
This signals strong downside momentum and raises caution for the near term.
Next level to watch is 0.382 Fibo. Let' s see if the 50EMA can provide good support.