
For technical charting, I think this is useful. May teach ourselves from what SGYuan has shared over the years. He is a real technical expert using established trading norms and rules.
Take a good look through SGYuan' s almost 8,000 posts, you may find something useful.
I hope he publishes a book and teach it in a proper course.
Take a good look through SGYuan' s almost 8,000 posts, you may find something useful.
I hope he publishes a book and teach it in a proper course.
few stock start to move
cement
the place holding
jt
sunpower
Thomson
koh eco
mercurius
v2y
hosen
hong fok
excitement comimg
cement
the place holding
jt
sunpower
Thomson
koh eco
mercurius
v2y
hosen
hong fok
excitement comimg
i am in telegram so not much to come here
how come i didn't see this ?
Elliott wave basic w1 to 5 wa wb wc
w1/w3/w5/wa/wc can be expended to another 8 wave
and this iteration can continue and continue
this is wave in wave in wave
Elliott wave basic w1 to 5 wa wb wc
w1/w3/w5/wa/wc can be expended to another 8 wave
and this iteration can continue and continue
this is wave in wave in wave
HappyZero ( Date: 04-Jun-2020 00:39) Posted:
|
hi. i moved our convo over from 3Cnergy.
the wave abc up should not use
but at that time is the best fit for the flow
it didnt turn out correct
look at day chart to spot the main ew
the smaller ew may be connected using samller time frame
in ew as per my experience can goes upto 3 level
4th level is hard to come by
do you mind explaining the sentence in bold? i don' t really get it.
is upward wave always in w1 to w5 (5wave movement?) and downward wave always in wa,b,c? or does it depends on main wave?
or is it best to work out a best fit line?
for this case if i use a 5 wave then it will be very high
and dont make sense
by using a wabc up
u can set a low limit so as it dont break ur low limt
this is not in txt book
i come out myself
and dont make sense
by using a wabc up
u can set a low limit so as it dont break ur low limt
this is not in txt book
i come out myself
HappyZero ( Date: 21-May-2020 14:05) Posted:
|
The below is your data for Broadway:
it can be
ew 71 83 78 w3?
w1 12
w2 5
w3 19 tgt 89 px hit 102 delta 22 up 183%
w4 8 tgt 94
- px hit low 95
w5 21 tgt 116 up 61.8% of 34
- wabc up 95 110 ?102 ?119
Why sometimes w5 up 5 waves, w1,w2,w3,w4 and w5. But sometimes up Wabc?
SgYuan ( Date: 21-May-2020 12:06) Posted:
|
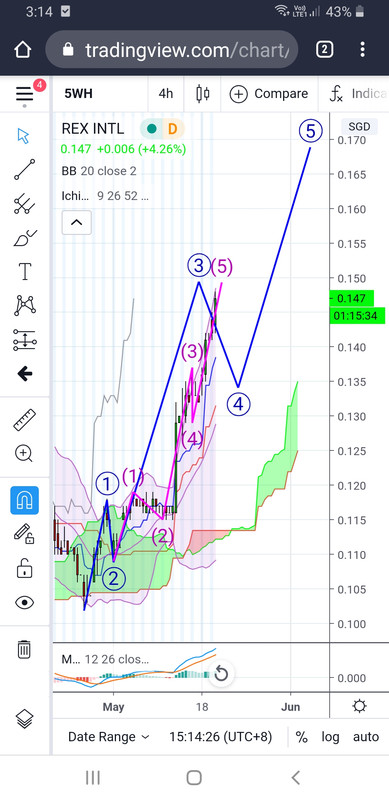
rex example for extended ew
Meaning
- ew : elliott wave
- px : price
- tgt : target price
- w3 ext ew : w3 extended ew means another 5 waves
- w5 ext ew : w5 extended ew means another 5 waves
- wb ext ew : wave b extended ew means another 5 waves
- wc ext ew : wave c extended ew means another 5 waves
Example eDev
ew w0 41 w1 57 w2? w3? w4? w5?
w1 up delta 57-41=16
w2 dn delta 61.8% of w1=61.8% of 16=10 tgt=57-10=47
- px 47 must be supported then
- next w3 ext ew can come (another 5 wave)
w3 up delta 161.8% of w1=161.8% of 16=26 tgt=47+26=73
- w3 ext ew
w3 ext ew w0 47 w1 56 w2 49 w3? w4? w5?
w1 9
w2 7
w3 15 tgt 64 up 161.8% of w1 delta 9
- px hit 63 now
- now here
w4 6 tgt 58 dn 38.2% of w3 delta 15
w5 9 tgt 67 up 100% of w1 delta 9
Then return to main ew
w4 ? dn 38.2% of w3 delta
w5 ? up 100% of w1 delta
SgYuan ( Date: 08-Apr-2020 22:45) Posted:
|
sti
4h mid bollinger 2571
- px hit low 2581 and rebounded
- very strange sentiment
4h mid bollinger 2571
- px hit low 2581 and rebounded
- very strange sentiment
halleluyah ( Date: 16-Apr-2020 09:05) Posted:
|
If the announcement affect all sector yes
- all stock will likely to test day/week low support
- all stock will likely to test day/week low support
WL123456 ( Date: 16-Apr-2020 09:14) Posted:
|
Usually it will be broken due to an important announcement right?
SgYuan ( Date: 16-Apr-2020 09:04) Posted:
|
more bad results coming fr US n all mkts...pull back...
SgYuan ( Date: 16-Apr-2020 09:03) Posted:
|
actually i dont do that
unless it break the wave formation
unless it break the wave formation
WL123456 ( Date: 16-Apr-2020 08:59) Posted:
|
sti
day chart has hit upper bollinger 2667
should correct
day chart has hit upper bollinger 2667
should correct
halleluyah ( Date: 16-Apr-2020 08:58) Posted:
|
Yuan, every time there is an announcement on statistic, you will reset the wave right?
SgYuan ( Date: 16-Apr-2020 08:49) Posted:
|
is sicko sti going down fr 60-80 points???
if w2 dn 50%
- then w3 up should be >161.8%
- but as a guide still use 161.8%
if w2 dn 70%
- then w3 up may reduce
- but still use 161.8% as a guide
when the actual data come in
then decide to close on w3 or hold for w5
if w3 come in below 161.8%
- mean not powerful
same for w4 still use 38.2%
if drop 30% mean w5 may be stronger
in theory it only mention w5 projection
- 100% of w1
- 61.8% of w1+w3
w3/w5 extended power sometime is 261.8%/361.8%/461.8%
HappyZero ( Date: 15-Apr-2020 22:34) Posted:
|
w2 typical 61.8%.
if it goes dn 50% or 70%, does it affects the projection of
w1 delta w1 peak - w0 start
w2 dn 61.8% of w1 delta
w3 up 161.8% of w1 delta
w4 dn 38.2% of w3 delta
w5 up 100% of w1 delta
w5 up 61.8% of w1+w3 delta if w3 > 161.8%
if w2 dn 50% (instead of 61.8%), does it means w3 up 150%, w4 down 50%.
similiarly, if w2 dn 70%, does it means w3 up 170% and w4 down 30%?
will the w2 dn percentage affect the other w3 and w4 up/dn percent?
Thank you very much and i look forward to your reply =)
SgYuan ( Date: 15-Apr-2020 12:00) Posted:
|