
wow...
TikTalk ( Date: 27-Apr-2022 18:22) Posted:
|
Ahahahaha today company share buy back 500k at 0.885.
Thats true bro.
bamboo300306 ( Date: 26-Apr-2022 21:34) Posted:
|
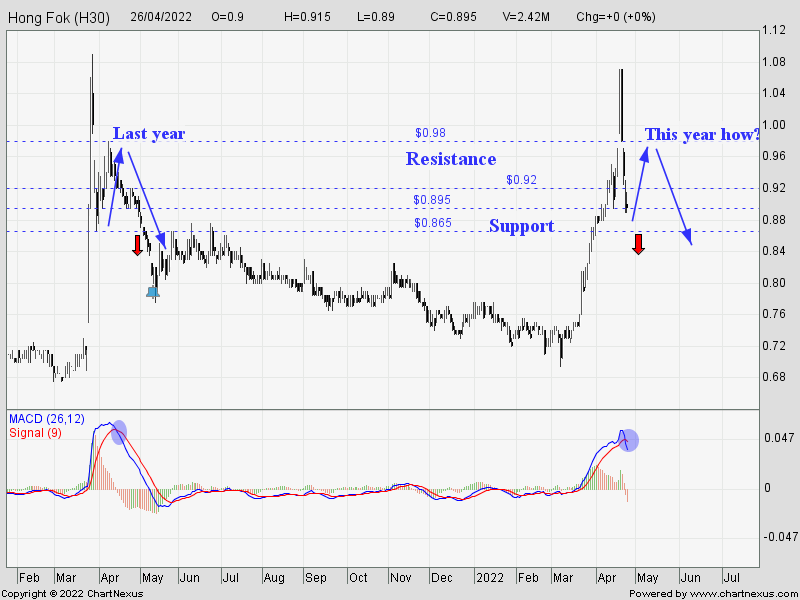
From here how?
Will it rebound like last year before selling off again?
I enjoy asking question first, then observe, if I feel the same then act, right or wrong
is another matter.
Hypothetical : Lets say coming days 0.865 hold and rebound at least you can still tell
yourself to hand on if still long. (If break then you decide yourself lor). If hold and retest 0.98 then
you see whether can break above or fail like last year then decide for yourself. But if one is undecisive
and worry about making the wrong choice, that I cant help. Charts and levels I can provide, but
I also dunno how when test those level, I am not god, levels accurate or not I also dunno.
I just make preperation and see how as it goes.
Cheers and all the bre@st.
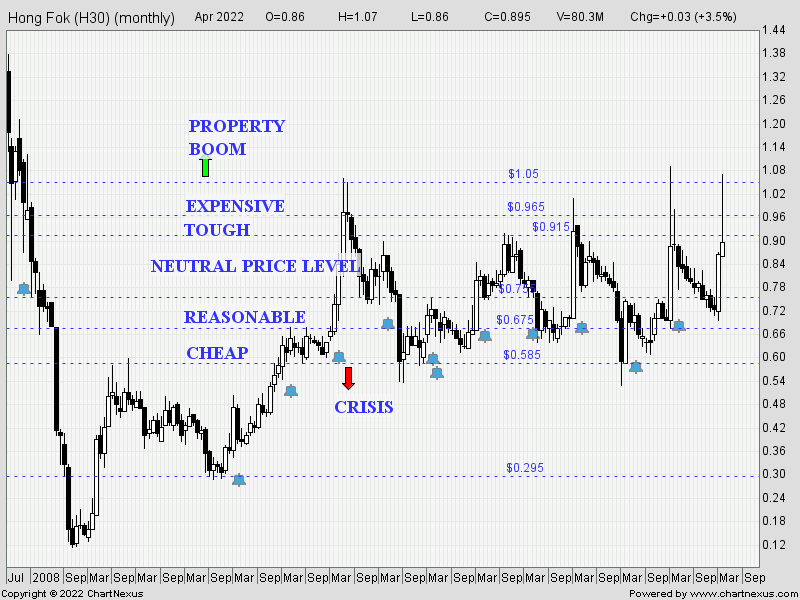
I hope below chart will be useful to members for reference as to which level are they
comfortable with to take position.
For example when I label ' Reasonable' , it refer to level between the lower and upper
horizontal lines, in this case 0.675 to 0.75 cent.
These are just my personal view base on chart observation.
Caution : One should not just follow it blindly. As I do not know what else can happen
to the company or the property market in the future, while comment made here were
based on historical chart to date.
All the bre@st
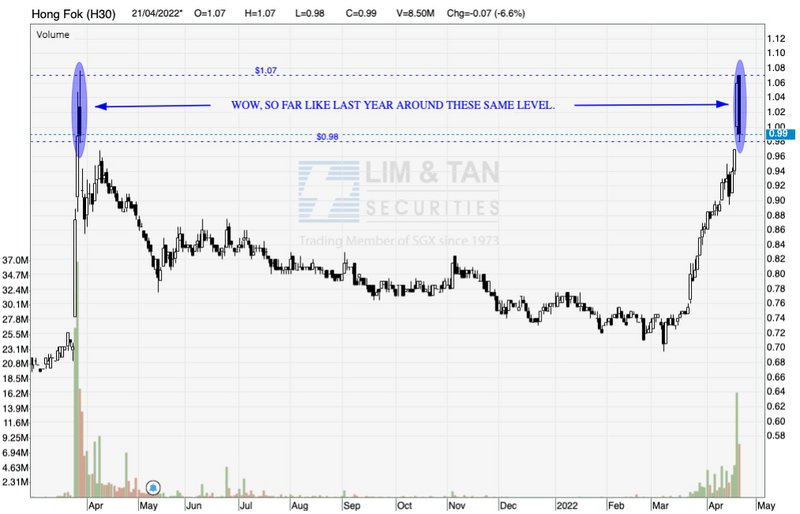
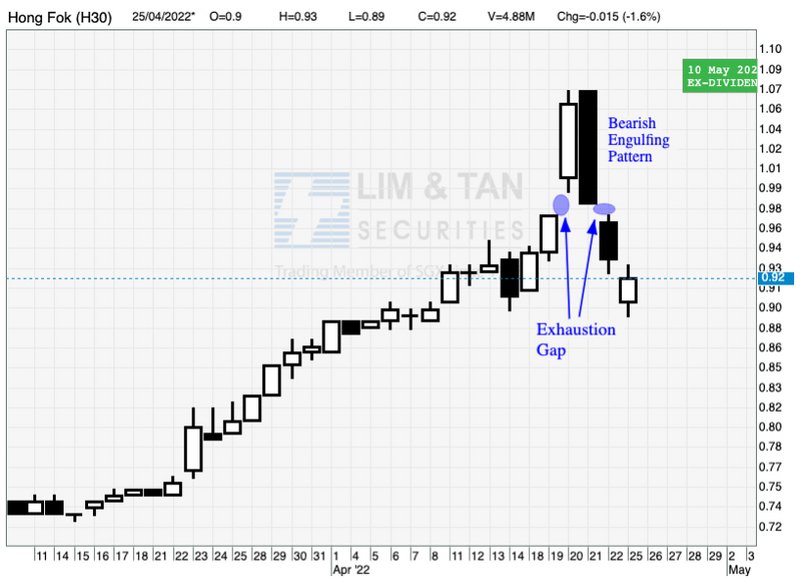
I highlighted this chart in the previous HF thread asking a question if the market
was behaving the same as 2021, but the stock was so hype up with privatising
rumours and news article just as last year, of course this year is slightly different
as many witness the share buy back by company and individual directors. Some
market participants were caught off guarded when filing of anthor director reducing
its shareholding on 21st April, worse was he sold again the next day causing further
downmove in prices as participants reacted to the news.
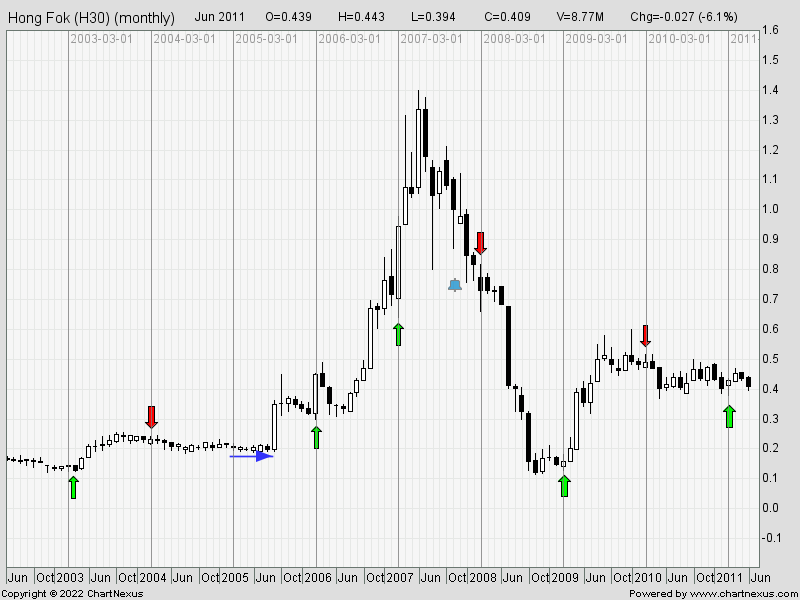
Another seasonal trend chart from 2003 to 2011
Here is another chart that I am consolidating here for easy reference.
Thanks all for viewing.
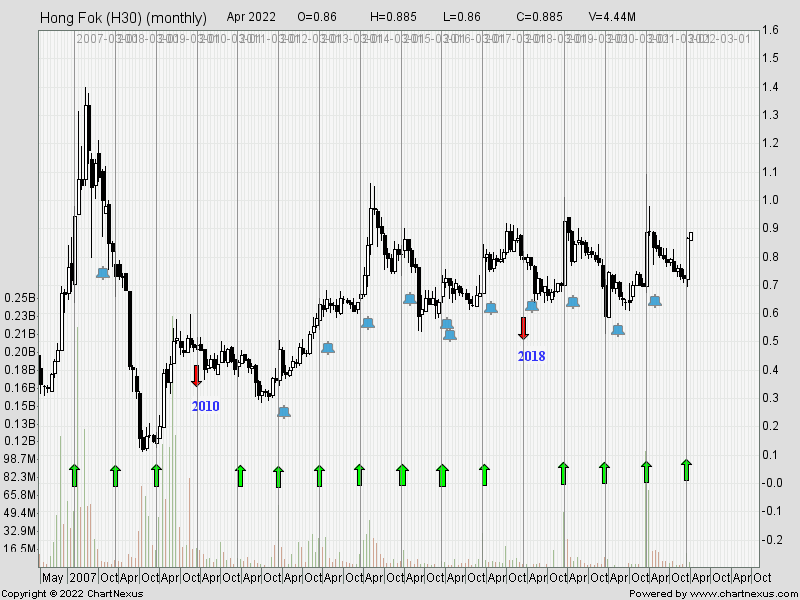
Posting charts for future reference reminding interest participants of these Hong Fok seasonal trend.
Every year there will be one or two months that his stock does particularly well due to repeatative
undervalue play.
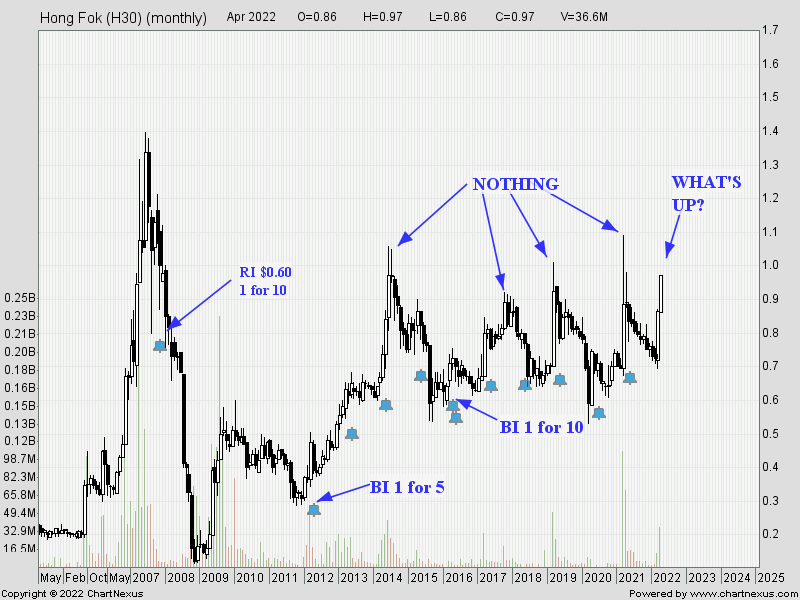
Whatever a stock NAV is, it does not necessary means the stock price must be near to that value.
So far, whether there is any possibility of offer to delist were all base on market speculation.
Personally I do not buy all these stories circulating around.
Market participants should just be concern with what price should we be buying that is comfortable
for us to trade it in the short term or hold it for longer term and profit from it.
Let not spread rumours or make assumption that cannot be substantiated.
Also my chart posted in other HF thread was wasted when a thread becomes over speculative.
Cheers & all the bre@st.
Every year there will be one or two months that his stock does particularly well due to repeatative
undervalue play.
Whatever a stock NAV is, it does not necessary means the stock price must be near to that value.
So far, whether there is any possibility of offer to delist were all base on market speculation.
Personally I do not buy all these stories circulating around.
Market participants should just be concern with what price should we be buying that is comfortable
for us to trade it in the short term or hold it for longer term and profit from it.
Let not spread rumours or make assumption that cannot be substantiated.
Also my chart posted in other HF thread was wasted when a thread becomes over speculative.
Cheers & all the bre@st.