Post Reply
21-40 of 54
Post Reply
21-40 of 54
Trading very similar like IX Bio down to the bottom for many years...trade with care
JurongW ( Date: 18-May-2026 17:26) Posted:
Ultragreen in free fall ?
 |
|
Ultragreen in free fall ?
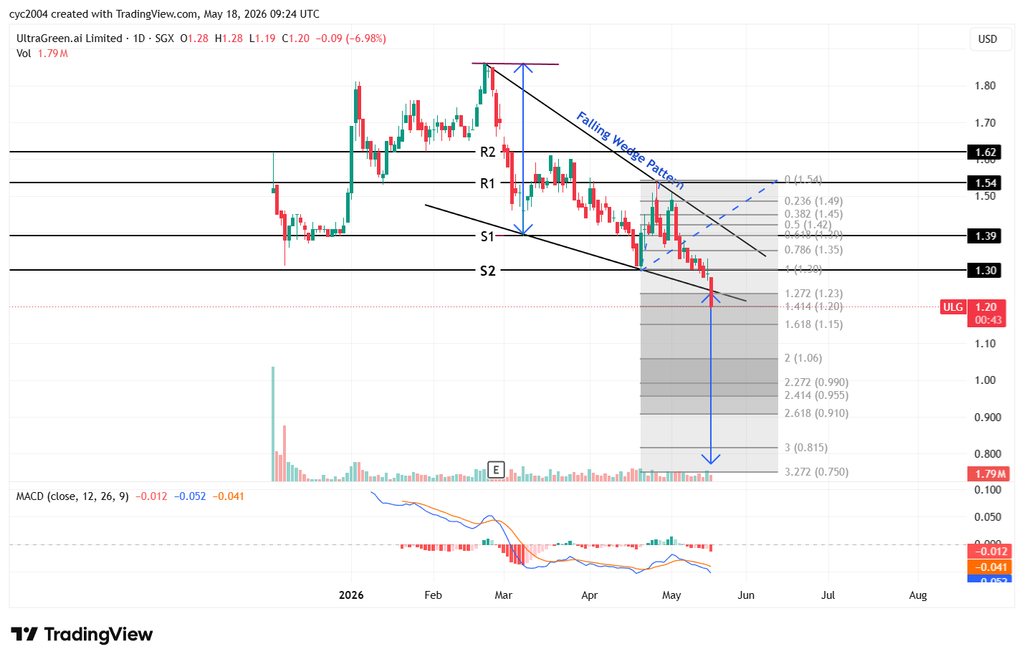
Trend is still bearish. May go down to test the lower channel of the falling wedge tomorrow.
At best hope for double bottom at 130 and rebound from there.
alexvar ( Date: 13-May-2026 16:17) Posted:
what is going on?
will this AI up shoot up anytime soon?
JurongW ( Date: 08-May-2026 15:20) Posted:
|
|
|
what is going on?
will this AI up shoot up anytime soon?
JurongW ( Date: 08-May-2026 15:20) Posted:
|
A falling wedge is a bullish chart pattern that forms when price makes lower highs and lower lows within two converging downward sloping trendlines, and typically signals an upcoming breakout to the upside once resistance is broken.
📊 Structure of a Falling Wedge
- Trendlines:
- Upper line = descending resistance (connecting lower highs).
- Lower line = descending support (connecting lower lows).
- Shape: Wide at the top, narrowing as price declines, forming a cone.
- Volume: Often decreases during formation, showing fading selling pressure.
- Breakout: Bullish confirmation comes when price breaks above the resistance line, often followed by a retest.
🔎 Key Characteristics
- Bias: Despite the downward slope, the falling wedge is bullish.
- Context:
- Reversal pattern when it appears after a downtrend &mdash signals trend change.
- Continuation pattern when it appears during an uptrend &mdash signals pause before resumption.
- Psychology: Sellers push price lower, but each push weakens. Buyers gradually regain control, leading to an upside breakout.
📉 vs 📈 Comparison
| Pattern |
Slope |
Bias |
Typical Outcome |
| Rising Wedge |
Upward |
Bearish |
Breakdown lower |
| Falling Wedge |
Downward |
Bullish |
Breakout higher |
⚠ ️ Trading Implications
- Entry: Traders often buy once price closes above the resistance line.
- Stop loss: Placed below the wedge lowest low.
- Profit target: Often the start of the wedge formation or measured by the widest part of the wedge projected upward.
- Risk: False breakouts can occur confirmation with volume or indicators (RSI, MACD, divergence) strengthens reliability.
✅
Takeaway: A falling wedge looks bearish at first glance because price is sliding, but it is actually a bullish setup. The narrowing range shows sellers losing steam, and once resistance breaks, momentum usually flips upward.
JurongW ( Date: 06-May-2026 23:03) Posted:
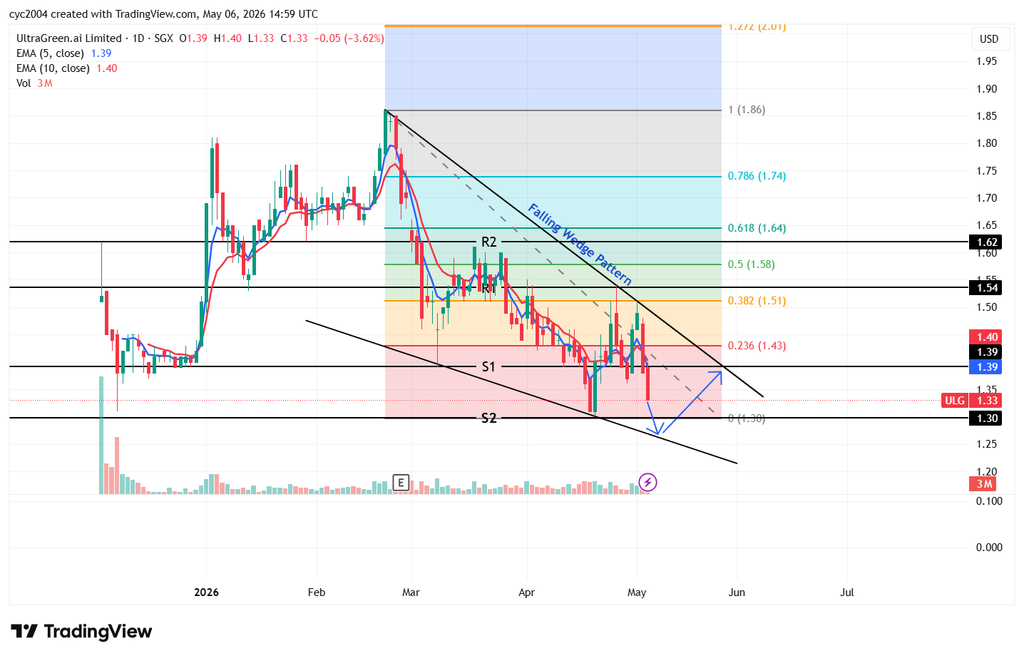
Updated chart - If S2 fail to hold
 |
|
market sell on the " regulatory approval" news in Spore.....
JurongW ( Date: 03-May-2026 18:27) Posted:
A postive update will be most helpful.
n3wbie ( Date: 03-May-2026 17:44) Posted:
| 1Q business update will be announced before market on Tue, 5 May so perhaps that will determine if that can support the breakout |
|
|
|
Updated chart - If S2 fail to hold
A postive update will be most helpful.
n3wbie ( Date: 03-May-2026 17:44) Posted:
1Q business update will be announced before market on Tue, 5 May so perhaps that will determine if that can support the breakout?
JurongW ( Date: 01-May-2026 16:50) Posted:
Updated chart as of 30 Apr, 5pm
 |
|
|
|
1Q business update will be announced before market on Tue, 5 May so perhaps that will determine if that can support the breakout?
JurongW ( Date: 01-May-2026 16:50) Posted:
Updated chart as of 30 Apr, 5pm
|
|
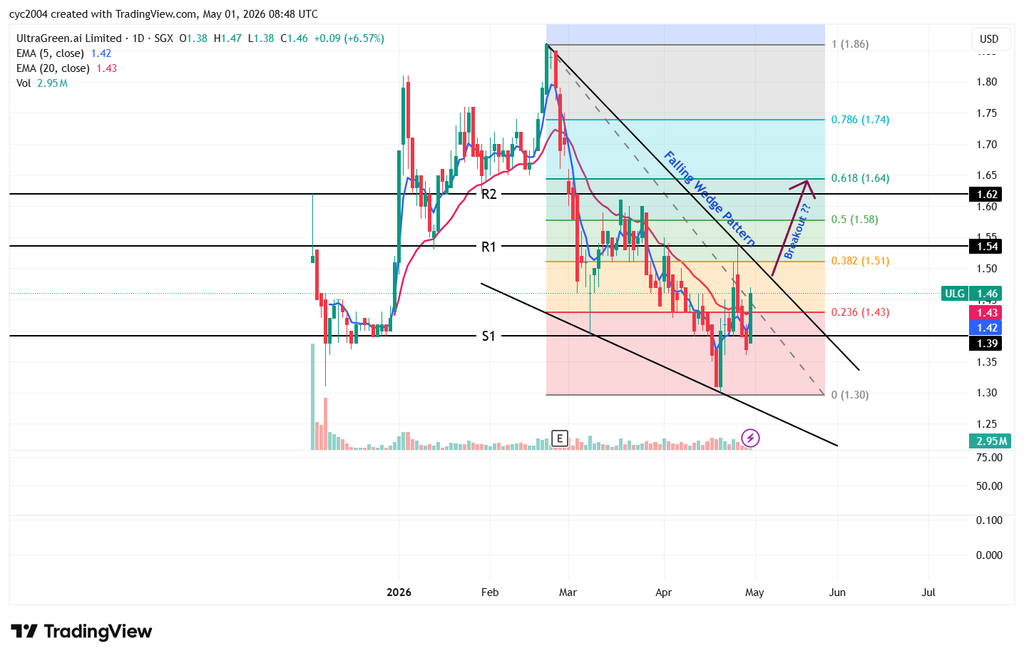
Updated chart as of 30 Apr, 5pm
Breakout confirmed, Golden cross pending.
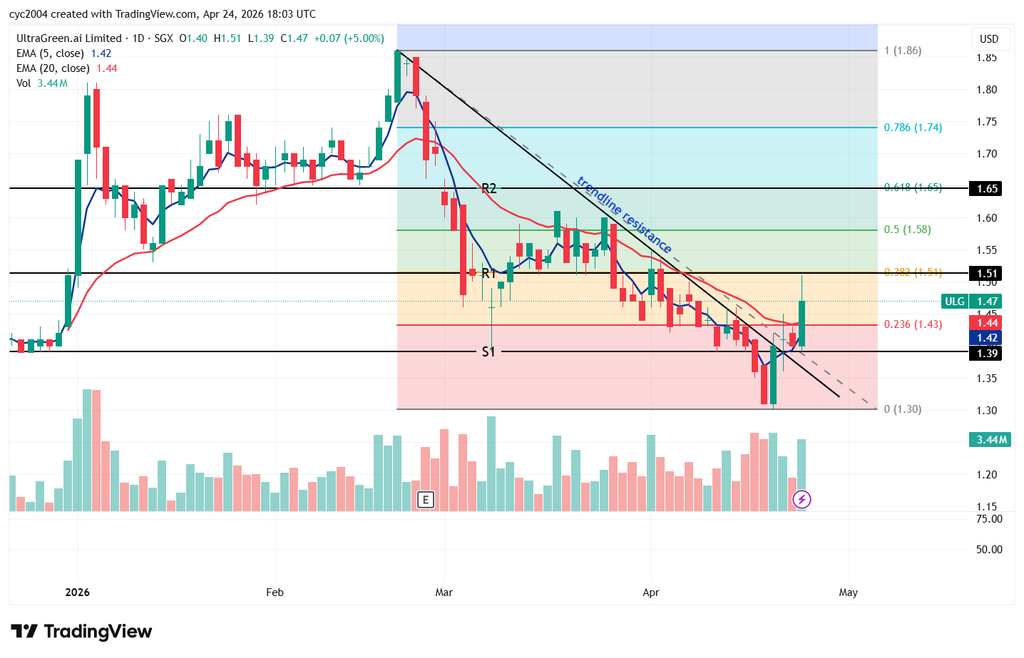
Trendline resistance broken on 22 Apr, with two candles holding above, confirming the end of the downtrend from 1.86 to 1.30.
On Fri 24 Apr, price hit resistance at the 0.318 Fibonacci level before retracing.
There is a fair chance it could move on to test the next two Fibonacci levels, with a short-term golden cross adding further confirmation.JurongW ( Date: 25-Apr-2026 02:07) Posted:
|
Share price seems to have rebounded off lows of $1.30 to be slightly above IPO price. Anything interesting from the AGM for those who might have attended?
Thank you for sharing the TA. Based on the responses to shareholders questions ahead of AGM, it seems like the business had limited impact from the recent Iran war and if so, the current correction in share price is a good buy-on-dip opportunity. Look forward to what they share at AGM and also 1Q business update on 5 May.
JurongW ( Date: 21-Apr-2026 20:40) Posted:
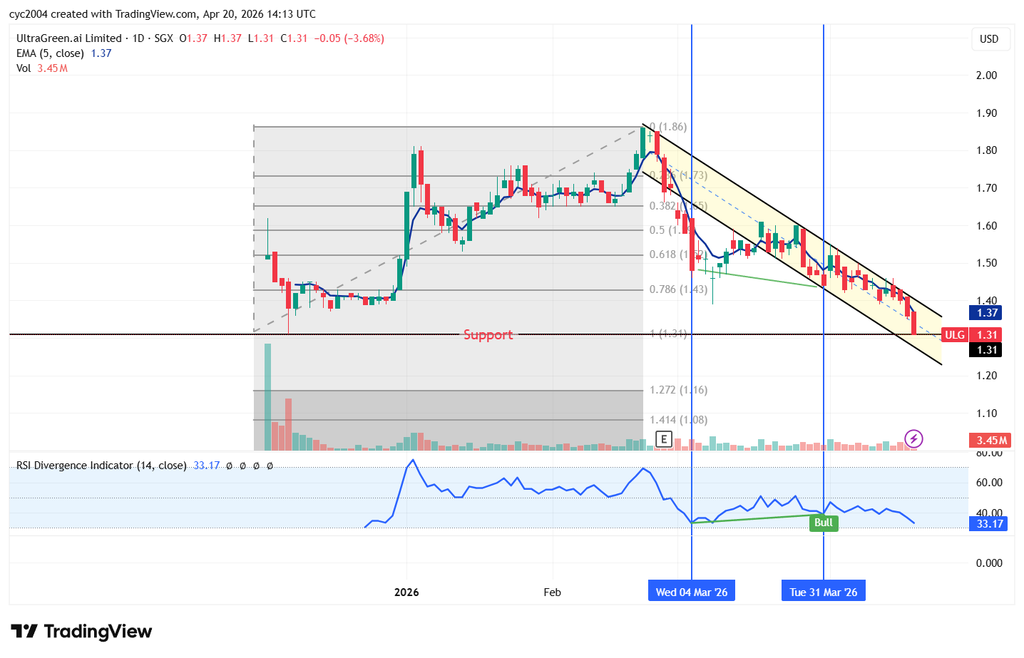
I placed this counter under my watchlist as it caught my attention when Nicky Tan continue buying shares as well as share price hitting the previous bottom.
The recent bearish candlestick closed below the 5EMA, with share price testing critical support near ~1.30, further downside would be implied if that level breaks.
Today close at $1.40, up 9 cents, suggests smart money may be stepping in to catch the bottom.
The price is now kissing the upper channel, the key question is whether it can break past this resistance. Tomorrow price action will provide the answer.
n3wbie ( Date: 20-Apr-2026 22:20) Posted:
| Under watch list for a bull or bear setup |
|
|
|
I placed this counter under my watchlist as it caught my attention when Nicky Tan continue buying shares as well as share price hitting the previous bottom.
The recent bearish candlestick closed below the 5EMA, with share price testing critical support near ~1.30, further downside would be implied if that level breaks.
Today close at $1.40, up 9 cents, suggests smart money may be stepping in to catch the bottom.
The price is now kissing the upper channel, the key question is whether it can break past this resistance. Tomorrow price action will provide the answer.n3wbie ( Date: 20-Apr-2026 22:20) Posted:
Under watch list for a bull or bear setup?
JurongW ( Date: 20-Apr-2026 22:16) Posted:
Under watchlist
 |
|
|
|
UltraGreen.ai Limited wishes to announce that it will be releasing its Business Update for the first quarter ended 31 March 2026 on Tuesday, 5 May 2026, before market open.
The presentation slides will be made available on SGXNet and the Company' s website.