
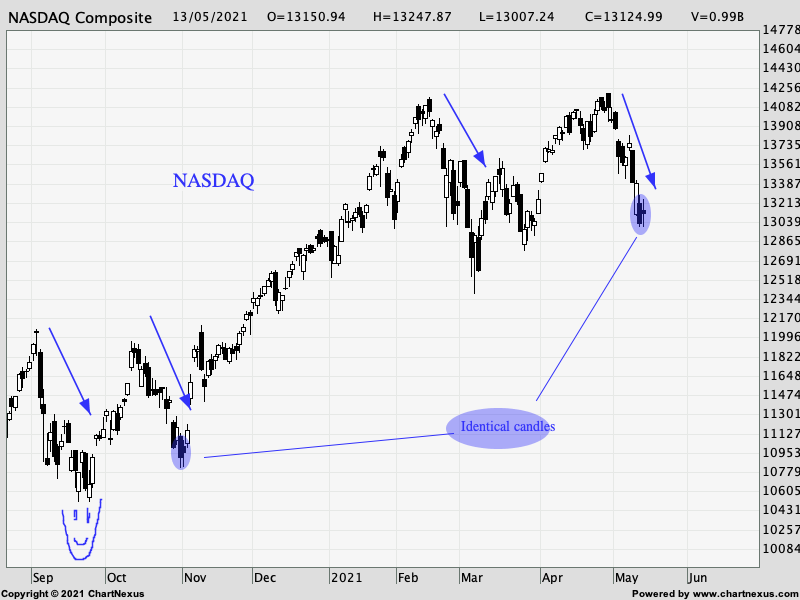
14th May 2021
Nasdaq - Daily Chart
Identical price behavior. Last two days Nasdaq candle chart mirror the last November low , see both shaded area.
I also noticed this correction phrase also mirror those between Sep to Nov 2020(see those 4 blue arrows)
If indeed Nasdaq bottom out like last November then holding tech and semi-conductor stock will have something
to look forward to.
But personally I dont expect Nasdaq to shoot up like last November because valuation are higher now than before.
Therefore I suspect it will be a gradual climb assuming we have bottom.
Stock like UMS, Frencken etc already bounce pretty nicely.
Good luck to all.
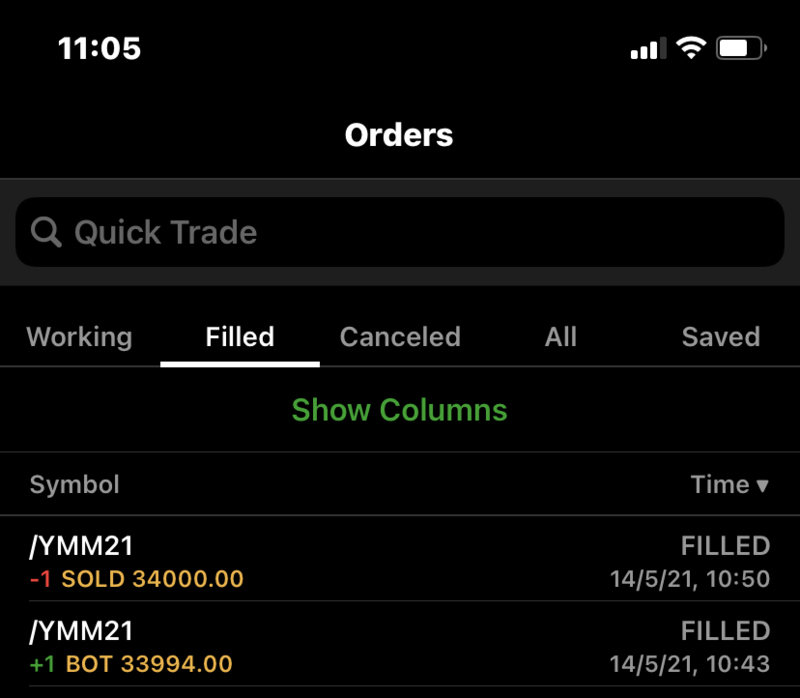
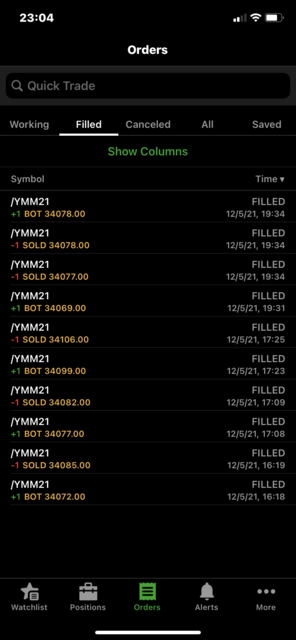
First trade today with Dow futures.
Saw a bid of 34004 when I want to lquidate my long at 33994.
Send a market order but filled at 34000 which is 4 bids lower, made USD20 less.
Haha that trading with market order(will execute at the next best bid).
Its ok made 6 bids in 7 minutes = USD30 also good,
Saw a bid of 34004 when I want to lquidate my long at 33994.
Send a market order but filled at 34000 which is 4 bids lower, made USD20 less.
Haha that trading with market order(will execute at the next best bid).
Its ok made 6 bids in 7 minutes = USD30 also good,
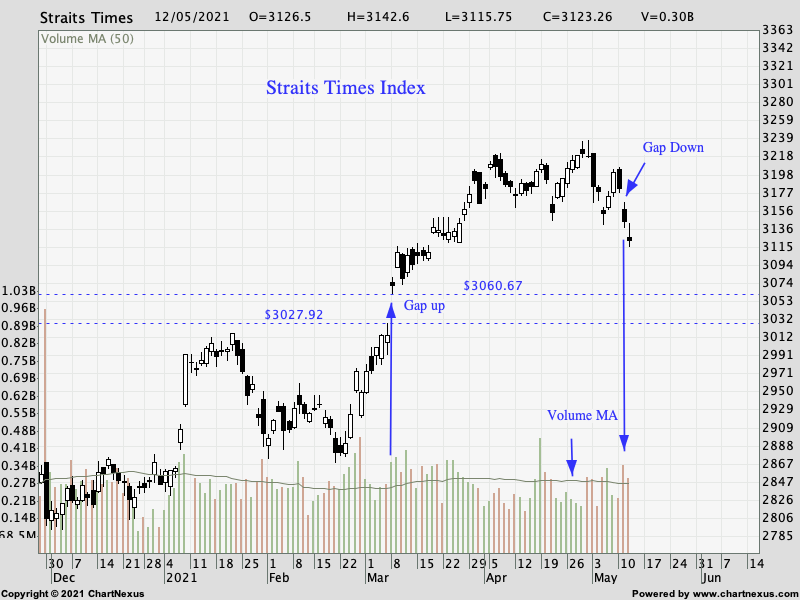
13th May 2021
Straits Times Index
Gaps : Runaway and Exhaustion Gap
In this post I would like to share on gaps and since its also rather relevent as they occur just
above and below the current level of STI.
Runaway Gap - The gap up on 8th March did meet the criteria of high volume as can be seen from the blue
upward pointing arrow the volume of that day was above the volume moving averages(small blue down arrow below
the word Volume MA.
Exhaustion Gap - The gap down on 11th May also did fulfil the requirement of high volume as can be seen from
the long blue downward pointing arrow.
I highlighted this 2 gaps of relevent because if a more severe correction were to continue in the days ahead an
attempt to fill that runaway gap is always open.
And after this correction is over it may then resume upward to fill the exhaustion gap to.
Cheers
Yes Iron Sis, this is something we must work very hard on, guess I became complacent at that moment.
TieJiaoJie ( Date: 13-May-2021 18:44) Posted:
|
Congrats Bro TikTalk. I agree the hardest thing to follow is discipline. I have learnt that when I don't follow rules I will be punished big time. When it's time to close or cut loss must learn to do with no emotions 😂
TikTalk ( Date: 13-May-2021 17:53) Posted:
|
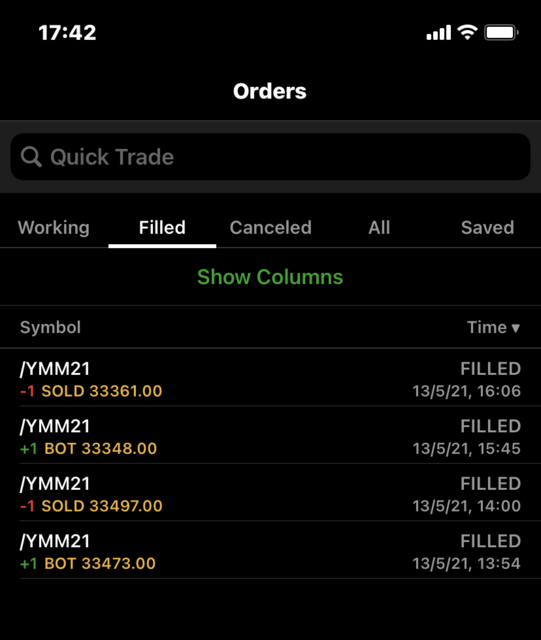
Made two trades this afternoon on the Dow futures...
I made two mistake for not going according to my plan :
Greedy, after a successful first trade I gambled more than what I should be doing, which is in
and out fast. Straight away I had a 20 bids profit that I did not take because of greed, wanted more.
Ended up I have to hold longer as it came back down to a point where it was more than my pre set
stop lost level, reason because I knew that there was a bullish divergence and I should not cut here,
but that should not be the way. Luckily it did turn out in my favor again. Have to stay discipline according
to my plan.
I share these details is to first remind myself and secondly hope my trading journey can be useful to another person
reading it.
Cheers
Just sharing my trades on the Dow yesteday evening.
Who else in SJ trade US futures?
Who else in SJ trade US futures?
Yes Sis halleluyah,
And thanks for being my first visitor...haha, your favorite sell in May is here.
Have a great public holiday.
And thanks for being my first visitor...haha, your favorite sell in May is here.
Have a great public holiday.
13th May 2021
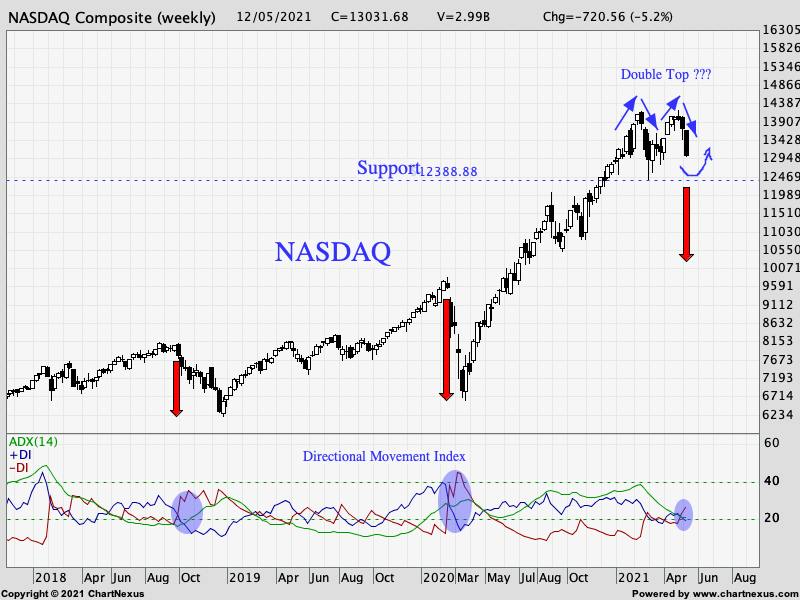
Nasdaq - Weekly Chart
For those into tech or semi-conductor stocks, you will want to keep a close watch on Nasdaq.
Personally I am also following the Philadelphia Semi-Conductor Index but essentially they
are both quite similar in movement.
Firstly, the support for Nasdaq is at 12397 being the low in the first week of March and also act
as a neckline for the POSSIBLE Double Top formation, repeat possible as one should not define it
till it has broken down below that line. False break of just a few points do happen so some technician
may use 2 consecutivclosing price below this level for confirmation.
If occur in the coming days or weeks then it will greatly impact its technical outlook, caution then must be exercise.
Now, what bulls would want to see is for Nasdaq to quickly form a base just above the horizontal support line and
make a turn up for this uptrend to continue something similar to that correction period between end August to early
November 2020.
The 3 shaded areas below the price chart highlighted on the trend indicator that I used namly Directional Movement Index
had a sell signal, but whether this sell signal is shortlive just like between May 2019 to Sep 2019 whereby the red and
blue indicators crossed over each other a few times remain to be seen. This would be welcoming for bull as the market
consolidate.
Above chart is for reference and reminder of some possible outcome in the near future.
I will be following up with new update in due course as when development arises.
All the br-east
Cheers
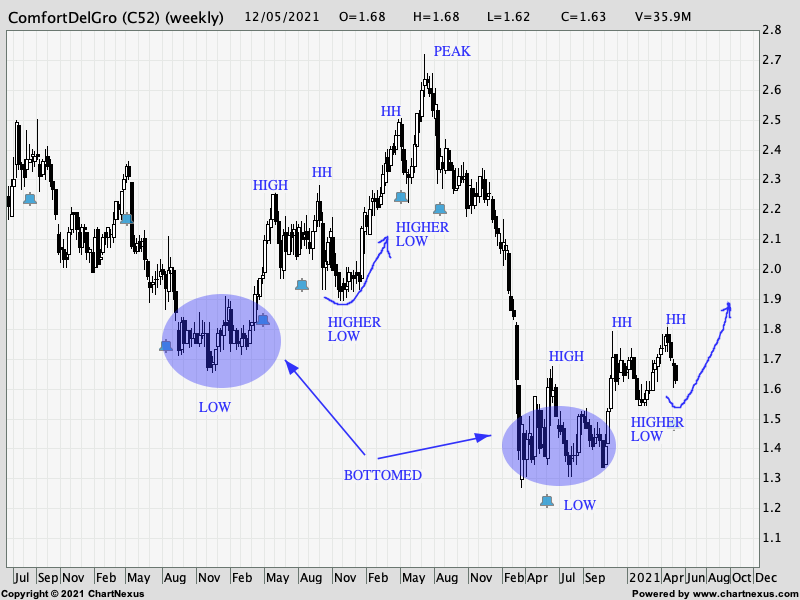
Repost here from earlier post at the CDG thread.
13th May 2021
CDG - Weekly Chart
Chart dont lie.
ComfortDelgro has already formed a bottomed(see shaded area) between end March to early November 2020
during the covid sell-off. Thats a solid bottomed by the way.
Ever since, there has been a series of higher high and higher low similar to that of 2018 trough(see shaded area)
to peak in July 2019. Therefore we can take comfort from that and CDG will be trending up again as the economy
open up further after this return to phase 2 is over.
Cheers
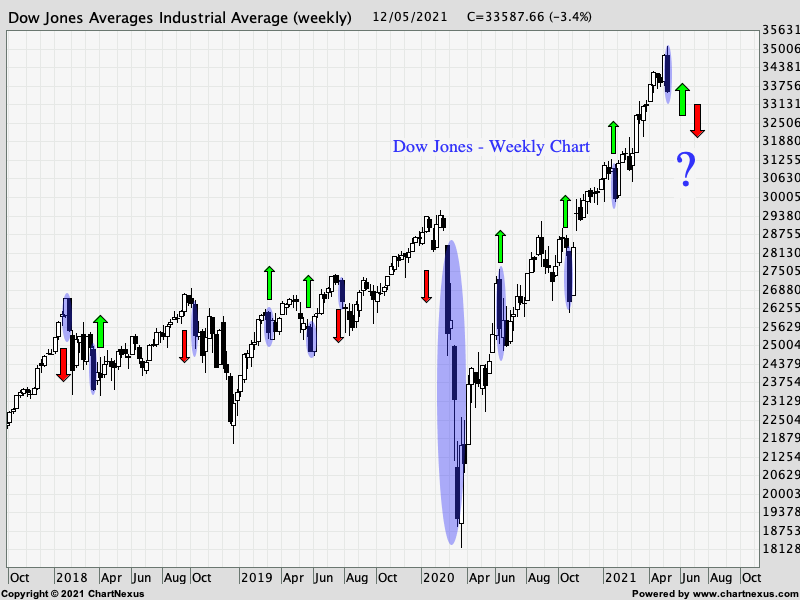
13th May 2021
Dow Jones -Weekly Chart
I know the week is not over but just using weekly chart for easy view.
Shaded areas are all mark to show sell-off of such magnitude such as this week triggered by U.S.
inflation data, CPI increasing 0.8 mom and 4.2% yoy fastest since 2008.
Of course recent down move was started by Nasdaq sell-off due to rotational play from growth to value.
Purpose of this chart is to visually observe how many of such sell-off magnitude leads to how much decline and
for how long a period?
Green arrow refers to periods when the sell-off was over within two to three weeks.
Red arrow refer to periods when the sell-off lasted more than four weeks to as long as twelve weeks.
1) The red arrow leading to the biggest sell-off was clearly last year covid pandemic and I wont bother to
work out the percentage dropped.
2) The next larger sell-off was from Oct 2018 to Jan 2019 (26951 to 21712) a dropped of 5239 points which
equate to 19.4% mini bear market.
3) The 3rd larger sell-off was from Jan 2018 to Apr 2018 (26616 to 23360) a dropped of 3256 points which
equate to 12.2% declined.
I cant predict how many % decline this time round or how many weeks it will last, this we have to monitor though.
The main purpose is for us to prepare ourself mentally to deal with this correction keeping above chart in mind.
There is still also a good percentage it can come and go within 3 weeks as indicted by the more than red green arrows.
Take care and all the br-east.
Cheers
When it goes up, stocks will be down n vice versa....
TikTalk ( Date: 13-May-2021 09:51) Posted:
|
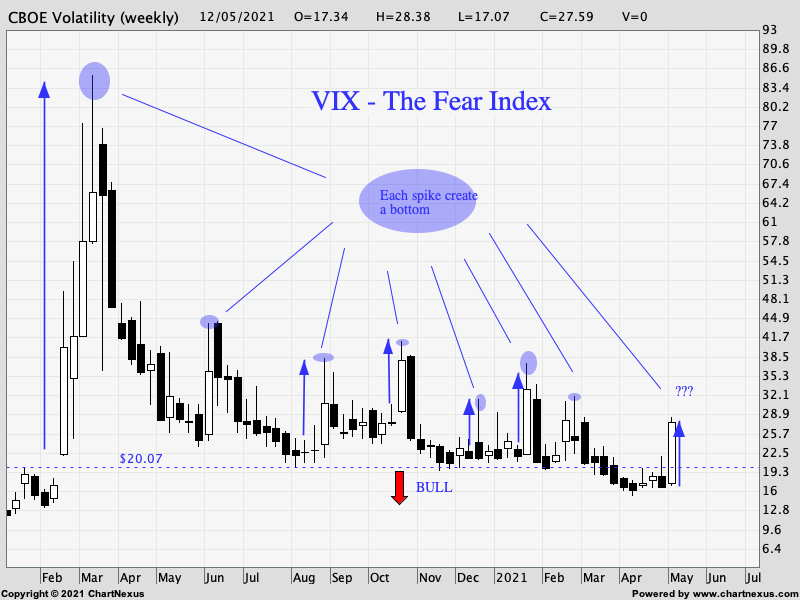
Stock market has been correcting in recent days, one of the index I watch is the CBOE Volatility Index,
also known as the fear index.
This index doesnt allow you to catch the bottom, but one way to use it is that when the level of fear fall below
20 then its a suggestion that the sell down has stabilize and safe to go long.
Cheers
also known as the fear index.
This index doesnt allow you to catch the bottom, but one way to use it is that when the level of fear fall below
20 then its a suggestion that the sell down has stabilize and safe to go long.
Cheers