


| Latest Forum Topics / Others |
|
|
US double top and breaking down... sell now
|
|||||
|
risktaker
Supreme |
01-Jun-2017 19:34
Yells: "Posts are opinions. Do not take it as investment advise " |
||||
|
x 0
x 0 Alert Admin |
Hehe what do u think
|
||||
| Useful To Me Not Useful To Me | |||||
|
risktaker
Supreme |
01-Jun-2017 16:54
Yells: "Posts are opinions. Do not take it as investment advise " |
||||
|
x 0
x 0 Alert Admin |
we plan to short in july.... june shall peak....
|
||||
| Useful To Me Not Useful To Me | |||||
|
|
|||||
|
risktaker
Supreme |
01-Jun-2017 16:21
Yells: "Posts are opinions. Do not take it as investment advise " |
||||
|
x 0
x 0 Alert Admin |
friend happy... IG us market showing profit liao... LONG AH | ||||
| Useful To Me Not Useful To Me | |||||
|
risktaker
Supreme |
01-Jun-2017 09:21
Yells: "Posts are opinions. Do not take it as investment advise " |
||||
|
x 0
x 0 Alert Admin |
Dear Fed, It' s Not " Really Hard To Spot Bubbles" by Tyler Durden
May 31, 2017 7:45 PM
Authored by Wolf Richter via WolfStreet.com, Here are some visual aids to help the Fed spot the housing bubble. Minneapolis Fed President Neel Kashkari was the latest Fed official to claim in an essay &ndash thus following in the time-honored footsteps of former Fed Chair Ben Bernanke &ndash that &ldquo spotting bubbles is hard,&rdquo that the Fed cannot see them, and that if it could see them, it shouldn&rsquo t do anything to stop them because it had only &ldquo limited policy tools,&rdquo and because &ldquo the costs of making policy mistakes can be very high.&rdquo But it&rsquo s OK to use these &ldquo limited policy tools&rdquo to inflate the greatest bubbles the world has ever seen and then preside over the damage they cause to the real economy before they even implode. Neither Kashkari nor anyone else working at the Treasury Department in 2006 &ndash when they were tasked by Secretary of the Treasury Hank Paulson to look for signs of trouble because they were &ldquo due for some form of crisis,&rdquo as he writes &ndash could see any bubbles, not even the housing bubble although it was already beginning to deflate. &ldquo It is really hard to spot bubbles with any confidence before they burst,&rdquo Kashkari writes, specifically naming stock prices and house prices. &ldquo Everyone can recognize a bubble after it bursts, and then many people convince themselves that they saw it on the way up.&rdquo So here are some visual aids I put together for Kashkari and other Fed governors. It will help them &ldquo spot&rdquo the beautiful housing bubbles in the US &ndash because bubbles really aren&rsquo t hard to recognize before they burst, if you want to recognize them. What&rsquo s hard to predict accurately is when they&rsquo ll burst. The S& P CoreLogic Case-Shiller National Home Price Index for March was released today. It jumped 7.7% year-over-year, far outpacing growth in household incomes. This has been the case for years. In fact, real household incomes are almost back where they were in 2006 (/sarc). So what could go wrong? At 198.26, the index surpassed the peak of Housing Bubble 1 in May 2006 by 11% (data via FRED, St. Louis Fed): 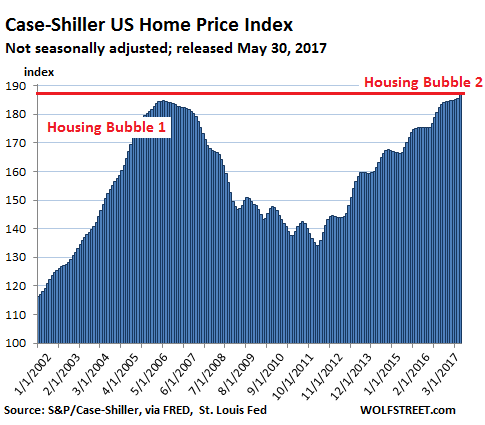
Since everyone called it a housing bubble after it had imploded, even Kashkari, today&rsquo s phase in the wondrous market is Housing Bubble 2, no? The other day, Zillow reported that the national median home value in April rose 7.3% year-over-year to $198,000. It too beat the peak of Housing Bubble 1 ($196,600) set in April 2007. &ldquo It only took a decade,&rdquo Zillow said. The National Association of Realtors reported that the median price in April hit $246,100, which is 6.8% above the peak of Housing Bubble 1 ($230,400 in June 2006). The Case-Shiller Index appears to have more stature at the Fed than Zillow or the NAR. So we&rsquo ll use it here in our visual aids for the Fed. It is based on a rolling-three month average hence, today&rsquo s release was for January, February, and March data. So it&rsquo s always behind. Instead of median prices, it uses &ldquo home price sales pairs,&rdquo for example, a house sold in 2011 and then again in 2017. Its algorithms adjust this price movement over the years and numerous other factors into a data point that becomes part of the index. The index was set at 100 for January 2000. So an index of 200 means prices have doubled in the past 17 years. Housing is local. Therefore housing bubbles are local. But if enough of them come together at the same time, the housing bubble takes on national proportions. This is the phase, as the above chart shows, that the US has now reached: In some metros, prices are still below the peak in other metros, prices are setting new records. Overall, prices have surpassed those of Housing Bubble 1. So dear Fed Governors, please have a look at some of the beautiful housing bubbles around the country. As you&rsquo ll see, they&rsquo re really not &ldquo hard to spot.&rdquo This is the Boston metro, where the current home price index is now 9% above the peak of Housing Bubble 1 (Nov 2005): 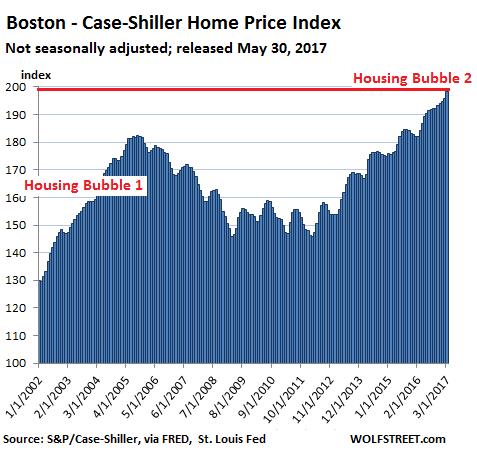
Prices in the Seattle metro have surged even more, pushing the index 13% above the peak of Housing Bubble 1 (Jul 2007): 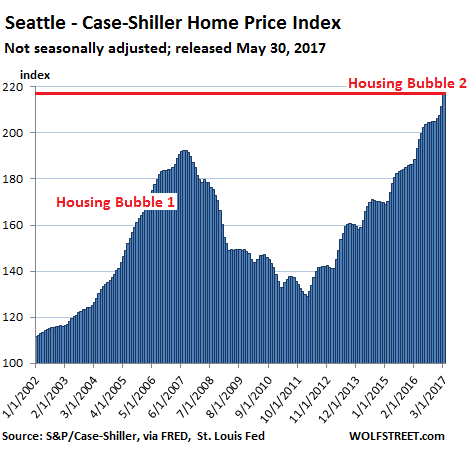
And here&rsquo s Denver&rsquo s house price bubble, where prices have soared a breath-taking 38% since the prior peak (Aug 2006): 
I know that folks in the Dallas-Fort Worth metro felt left out during Housing Bubble 1. I heard many complaints about that at the time. They also missed out on much of the house price crash. But they sure know how to make up for things. Home prices have now surged by 37% since the last peak in June 2007: 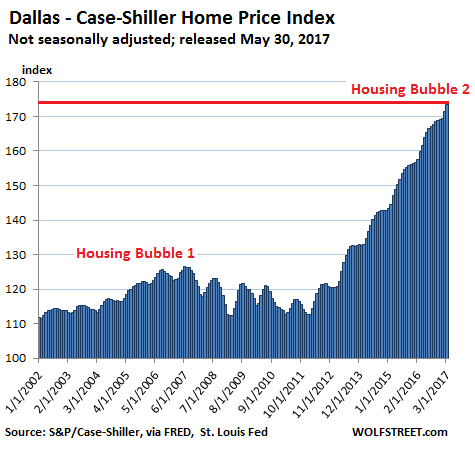
The Atlanta metro isn&rsquo t quite back to the peak of Housing Bubble 1, but it&rsquo s near-perfect V-shaped bubble recovery will soon hit it: 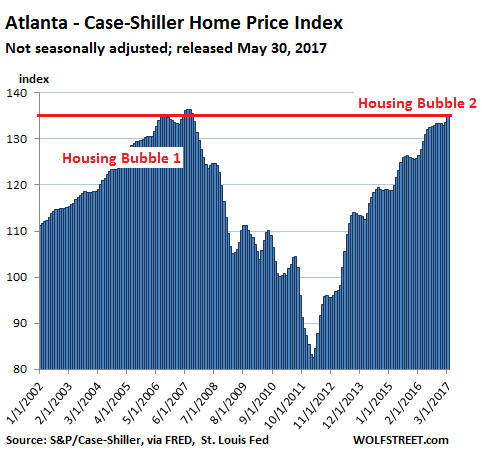
For the Portland house price bubble, the index is now 14% above the prior peak: 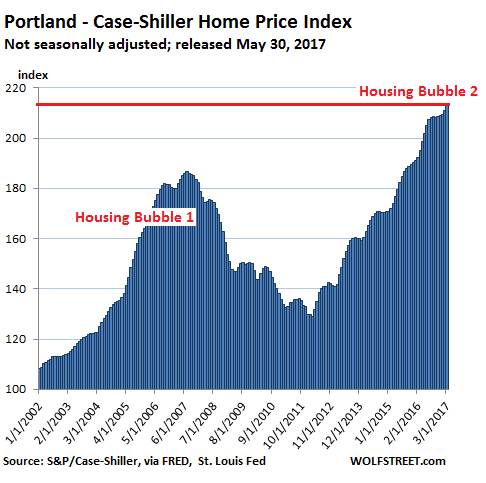
The Case-Shiller Index for San Francisco, which covers the five-county Bay Area, is now 7.7% higher than at the peak of Housing Bubble 1. However, in the city (and county) of San Francisco, the median home price has soared 47% above the prior peak (Nov. 2007). This is the chart for the five-county Bay Area house price bubble-crash-bubble: 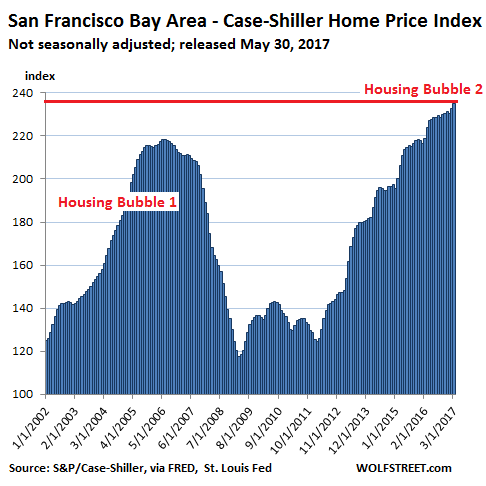
The city of San Francisco is also the first city in this lineup where the median home price is now heading south on a year-over-year basis. During Housing Bust 1, the City was late to react. This time, it seems to be ahead of the pack. And the Case-Shiller index for the condo price bubble in New York City has soared 17% above the prior peak (Feb. 2006), with prices nearly tripling since 2000: 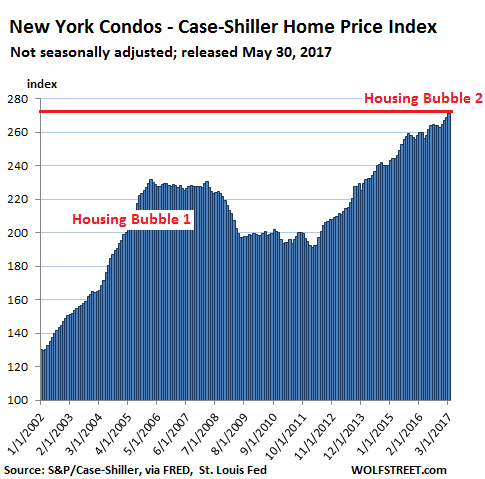
The local housing bubbles across the US blew up with spectacular consequences, all in their own time frames. Plenty of local home price bubbles are now coming together to form a national home price bubble. So it&rsquo s really not hard to spot them, Mr. Kashkari. Sure, there has been some inflation &ndash 17% since 2006, based on the Fed&rsquo s favorite core PCE measure. Home prices in some of the cities have already reached a new peak even after inflation. And besides, it&rsquo s not a housing bubble until it reaches the inflation-adjusted point where the prior one took down the financial system? Is that the point when Housing Bubble 2 begins, instead of ends? If so, what would Housing Bust 2 look like? A vision too ugly to behold. What&rsquo s hard to predict is the moment when housing bubbles begin to deflate. With monetary policies still in easing mode, with the federal government subsidizing the housing market in numerous ways, and with homes having become a securitized asset class for global speculators, house price bubbles can inflate &ndash as we have seen &ndash far more than a rational human mind might think possible. But we do know that they will deflate. In San Francisco, the signs and numbers are already lining up |
||||
| Useful To Me Not Useful To Me | |||||
|
famouspinky
Supreme |
31-May-2017 23:08
|
||||
|
x 0
x 0 Alert Admin |
Lol. Very lovely
|
||||
| Useful To Me Not Useful To Me | |||||
|
|
|||||
|
risktaker
Supreme |
31-May-2017 22:36
Yells: "Posts are opinions. Do not take it as investment advise " |
||||
|
x 0
x 0 Alert Admin |
Rebounding now | ||||
| Useful To Me Not Useful To Me | |||||
|
risktaker
Supreme |
31-May-2017 22:32
Yells: "Posts are opinions. Do not take it as investment advise " |
||||
|
x 0
x 0 Alert Admin |
Strong support at 20950 :) | ||||
| Useful To Me Not Useful To Me | |||||
|
risktaker
Supreme |
31-May-2017 22:22
Yells: "Posts are opinions. Do not take it as investment advise " |
||||
|
x 0
x 0 Alert Admin |
still early... and its stable now accumulation to chiong up later
|
||||
| Useful To Me Not Useful To Me | |||||
|
|
|||||
|
risktaker
Supreme |
31-May-2017 20:53
Yells: "Posts are opinions. Do not take it as investment advise " |
||||
|
x 0
x 0 Alert Admin |
https://www.google.com.sg/search?q=2032+risktaker+sharejunction& oq=2032+risktaker+sharejunction& aqs=chrome..69i57.8803j0j8& sourceid=chrome& ie=UTF-8 i think u can read those comments but if u click on the last 3 post u can access the older post back in 2010.... anyway 2032 came out first price |
||||
| Useful To Me Not Useful To Me | |||||
|
risktaker
Supreme |
31-May-2017 20:46
Yells: "Posts are opinions. Do not take it as investment advise " |
||||
|
x 0
x 0 Alert Admin |
you go google risktaker 2032 sharejunction .... you can see the post i made on jan 22 2010 :P
|
||||
| Useful To Me Not Useful To Me | |||||
|
risktaker
Supreme |
31-May-2017 20:04
Yells: "Posts are opinions. Do not take it as investment advise " |
||||
|
x 0
x 0 Alert Admin |
Tonight rally mode... shall be a record closed day
|
||||
| Useful To Me Not Useful To Me | |||||
|
risktaker
Supreme |
31-May-2017 18:50
Yells: "Posts are opinions. Do not take it as investment advise " |
||||
|
x 0
x 0 Alert Admin |
Euro in rally mode... dow positive now.. :) | ||||
| Useful To Me Not Useful To Me | |||||
|
|
|||||
|
famouspinky
Supreme |
31-May-2017 17:37
|
||||
|
x 0
x 0 Alert Admin |
Nt only change directions. Also change goal post. A pilot who doest fly his plane but do evrythg elses.
|
||||
| Useful To Me Not Useful To Me | |||||
|
risktaker
Supreme |
31-May-2017 17:30
Yells: "Posts are opinions. Do not take it as investment advise " |
||||
|
x 0
x 0 Alert Admin |
I think soros has few god sons | ||||
| Useful To Me Not Useful To Me | |||||
|
risktaker
Supreme |
31-May-2017 17:20
Yells: "Posts are opinions. Do not take it as investment advise " |
||||
|
x 0
x 0 Alert Admin |
Haha dont believe june will be a good month? Watch the next few days lor
|
||||
| Useful To Me Not Useful To Me | |||||
|
famouspinky
Supreme |
31-May-2017 16:39
|
||||
|
x 0
x 0 Alert Admin |
Buffet' s gd friend is Trump. Maybe hes getting ready to short? Who knows.
|
||||
| Useful To Me Not Useful To Me | |||||
|
NextEvolution
Elite |
31-May-2017 15:27
|
||||
|
x 0
x 0 Alert Admin |
You belong to the GOD status or are you one 大 炮 仙 ?
Seems to know the future. If you are that good, Warren Buffett would have come here to seek your advice
|
||||
| Useful To Me Not Useful To Me | |||||
|
risktaker
Supreme |
31-May-2017 15:19
Yells: "Posts are opinions. Do not take it as investment advise " |
||||
|
x 0
x 0 Alert Admin |
Crash is aug... market will rally for june
|
||||
| Useful To Me Not Useful To Me | |||||
|
junction
Master |
31-May-2017 15:16
|
||||
|
x 0
x 0 Alert Admin |
So your call for crash turned opposite now?
|
||||
| Useful To Me Not Useful To Me | |||||
|
risktaker
Supreme |
31-May-2017 15:09
Yells: "Posts are opinions. Do not take it as investment advise " |
||||
|
x 0
x 0 Alert Admin |
Likely market gonna set new high in june....
|
||||
| Useful To Me Not Useful To Me | |||||